Model photo: Mads Schmidt Rasmussen / norden.org
2. Child poverty trends in the Nordic countries: A two-decade review
2.1 Introduction
While the Nordic countries consistently rank among the world’s most prosperous and egalitarian countries, rising economic inequalities and shifting socioeconomic dynamics have exposed vulnerabilities within their societies (Aaberge et al., 2018; Kamande et al., 2024; Lundgren et al., 2020; Young Håkansson, 2024b).
Norway (1), Finland (5) and Denmark (6) are ranked among the 10 most committed countries and regions to reducing inequality by the Reducing Inequality Index 2024 (Kamande et al., 2024).
Over the past two decades, significant labour-market transformations, demographic trends, and policy frameworks have been noted as factors that may have influenced the prevalence and depth of child poverty (Epland & Hattrem, 2023; Normann & Epland, 2023; Statistics Sweden, 2020). These changes have brought increased attention to disparities across specific groups, including children in single-parent households and migrant families (Epland & Hattrem, 2023; Statistics Sweden, 2020; Young Håkansson, 2024b).
It should be noted that, at least in Sweden, the level of media attention given to the issue of child poverty has often not correlated with the actual extent of poverty, particularly when measured by absolute poverty (Jonsson & Mood, 2017).
This chapter examines the patterns and trends in child poverty across the Nordic region from 2003 to 2023. The primary objective is to shed light on long-term changes in child poverty while highlighting heterogeneity across different dimensions, such as geographical location, household characteristics, and migration background. The chapter does not utilise individual-level microdata but instead relies on aggregated Eurostat data to analyse trends in poverty indicators. Because Eurostat indicators are harmonised across countries, this analysis uses relative income measures that do not depend on national poverty definitions. This ensures full comparability, also for countries without an official poverty line, such as Denmark. While microdata enables the examination of specific population subgroups, aggregated data provides a clearer view of broader societal trends and developments. Therefore, rather than establishing cause-and-effect relationships, the chapter offers an overview of how the situation has evolved, inviting further reflection on child poverty in these countries. The findings emphasise the need for a more nuanced discussion on this issue and call for deeper analysis to understand how growing inequalities impact the most vulnerable members of Nordic societies.
2.2 Measuring child poverty
Poverty research largely agrees that the definitions and measurements of poverty should be adapted to the welfare and development level of the countries being studied. To address this, the distinction between absolute and relative poverty is commonly used (Schweiger & Graf, 2015). In this chapter, the term ‘child poverty’ refers exclusively to Eurostat’s at‑risk‑of-poverty‑ (AROP) indicators, which measure relative low income. No national poverty definitions are applied. Absolute poverty refers to the condition where individuals lack the bare minimum required for survival or a life severely hindered by deprivation, while relative poverty considers the resources necessary to maintain a standard of living deemed acceptable within a specific society (Alcock, 2006; Foster, 1998). In practical terms, absolute poverty refers to a fixed threshold of income or resources necessary to meet basic survival needs, typically determined by a specific poverty line. In Europe, various absolute poverty measures have been suggested, including national poverty lines and international standards such as those defined by the World Bank (Bradshaw & Movshuk, 2019). Measuring absolute poverty across countries is challenging due to variations in local prices, living costs, and definitions of basic needs.
Balancing cross-country comparability with local relevance requires integrating a common European living standard with country-specific minimum needs and detailed cost assessments (Menyhert et al., 2021). Differences in expenses, such as housing, food, and healthcare, can significantly affect whether individuals meet the poverty threshold, making direct comparisons difficult (Schweiger & Graf, 2015). Therefore, the EU does not provide an official measure of absolute poverty, while the World Bank offers three thresholds, which are significantly lower than the standards of all Nordic countries and are therefore considered irrelevant in our case (World Bank, 2024).
The World Bank employs three absolute poverty lines based on the level of development of the countries examined. These thresholds are set at $2.15 per person per day, representing extreme poverty, $3.65 per person per day, reflecting the national poverty lines commonly used in lower-middle-income countries, and $6.85 per person per day, which is more representative of upper-middle-income countries (World Bank, 2024)
Discussions on child poverty often lead to questions regarding the relevance of these indicators, particularly in Western welfare states. A key challenge in poverty research within modern welfare states is determining whether poverty thresholds should be based on absolute income levels of the families or on deprivation standards relative to societal norms. A common criticism directed towards relative measures of poverty is that these measures conflate poverty with general inequality, making it difficult to define true poverty. This has led to debates over whether relative poverty should be considered ‘real’ poverty. In wealthy societies, deeper income poverty – where families lack necessities such as shelter, healthcare, and nutrition – is relatively rare. Moreover, public perception often aligns with the idea that relative poverty does not constitute true poverty, further complicating discussions on poverty measurement (Schweiger & Graf, 2015).
However, it is important to recognise that relative poverty measures are shaped by normative perspectives on what constitutes a basic or decent life. While absolute poverty indicators focus on survival, relative poverty reflects societal expectations and prevailing living standards within the society the child is growing up in. Addressing relative poverty does not diminish the significance of absolute poverty, nor does concern for absolute poverty negate the struggles faced by those experiencing relative hardship. In high-income countries, this underscores the need for a multidimensional understanding of poverty that encompasses income, material deprivation, and social exclusion. This approach is also aligned with the United Nations Sustainable Development Goals (SDGs), particularly SDG 1, which aims to eradicate poverty in all its forms everywhere. Adopted in 2015, the SDGs emphasise that the definition and measurement of poverty should be context-specific, reflecting the economic, social, and environmental realities of different countries (United Nations Department of Economic and Social Affairs, 2025). Despite its limitations, relative income poverty has remained the primary indicator used within the EU and by Eurostat (Bradshaw & Movshuk, 2019), and is also employed in the Nordic Statistics Database (Nordic Statistics Database, 2025).
When focusing on children, it is important to note that since children generally do not earn income, poverty is measured at the household level rather than the individual level. For example, Eurostat measures poverty risk using data from the European Union Statistics on Income and Living Conditions (EU-SILC), relying on household income and adjusting it through equivalised disposable income to account for differences in household size and composition. The AROP indicator is based on equivalised disposable income, that is, household income after taxes and social transfers. Under this framework, children are considered at risk of poverty if they live in a household with an equivalised disposable income below 60% of the national median (Eurostat, n.d.-b, 2024c). Equivalised income is a measure of household income that accounts for differences in household size and composition, allowing for a more accurate comparison of living standards across different households (see also Eurostat, n.d.-d). Disposable income, as defined by Eurostat, is the net income available to households for spending or saving after deducting direct taxes and social security contributions and including government transfers and benefits. However, it is essential to recognise that children are not merely passive members of a household economy; they are individuals with unique needs and vulnerabilities shaped by their family environment and broader social context (Main & Bradshaw, 2012). Taking into account these considerations, this chapter will primarily rely on relative income poverty for families as its main measure of child poverty, but additional information on material deprivation will be added when possible.
2.3 Sources of heterogeneity in child poverty in the Nordic countries
Understanding relative child poverty in the Nordic countries requires careful consideration of its underlying heterogeneity. While these nations are often treated as a unified bloc due to their shared commitment to social welfare and egalitarian principles (Gornick & Jäntti, 2011), significant variations exist both within and between countries (Eklund Karlsson et al., 2022; Povlsen et al., 2018). This section outlines the key sources of heterogeneity that must be considered when analysing child poverty in the Nordic context.
Household composition
Household structure plays a pivotal role in shaping the risk of child poverty. Children in single-parent households face a substantially higher risk of poverty compared to those in two-parent families (Bostic, 2023; Maldonado & Nieuwenhuis, 2015; Young Håkansson, 2024a). This disparity is often driven by lower household income, reliance of fewer income sources due to reduced access to dual earners, and limited financial buffers in single-parent households. Families with a large number of children also tend to experience increased financial strain, as the cost of living rises with family size (Gornick & Jäntti, 2011).
Migrant and refugee status
Children from migrant or refugee backgrounds constitute one of the most vulnerable groups in the Nordic countries. These families often face linguistic and cultural barriers, limited access to labour markets, and, in some cases, restrictions on social benefits. Migrants are also more vulnerable to economic downturns, as limited language proficiency and educational gaps can delay labour market entry, even in periods of economic growth. Consequently, a larger share of the migrant population is at risk of poverty or social exclusion (AROPE). As a result, migrant children experience significantly higher poverty rates compared to their native-born peers (Epland & Hattrem, 2023; Galloway et al., 2015; Gustafsson & Österberg, 2016; Obućina & Ilmakunnas, 2020; Salonen et al., 2021). The heterogeneity within migrant groups – based on factors such as country of origin, duration of residence, and migration type – further complicates the picture (Gustafsson & Österberg, 2016; Obućina & Ilmakunnas, 2020).
Gender dynamics
Gender plays a subtle yet critical role in the analysis of child poverty. Single mothers are disproportionately represented among low-income households, affecting the well-being of children in such settings (Bostic, 2023; Gornick & Jäntti, 2011). In Nordic countries, the vulnerability of single-income households is particularly pronounced, as these welfare states are largely structured around a dual-earner model, where both parents are expected to participate in the labour market (Kasearu et al., 2017). A recent report by Save the Children Sweden (Salonen et al., 2021) highlights the precarious situation of children raised by single mothers, revealing a poverty rate of 9.4%, compared to only 1.2% among children of cohabiting Swedish-born parents. Even more concerning is the intersectional impact of migration and single parenthood: the poverty rate rises to 49.5% among single mothers with a migration background.
Geographical disparities
While the Nordic countries have regional disparities in the level of inequality (Grunfelder, 2020; Tapia et al., 2024) and poverty (Broström & Rauhut, 2017; Lundgren et al., 2020), regional disparities in child poverty are less well documented (see, however, Rauhut & Lingärde (2014) for the case of Sweden). Urban–rural divides may be particularly relevant, as households in rural areas have fewer labour market opportunities, lower household incomes than urban households, and higher commuting costs. Such factors can shape household income (Dzhavatova et al., 2025; Slätmo et al., 2024). In contrast, urban centres tend to have higher housing costs, which can contribute to financial strain for families with low incomes. Regional economic structures – such as dependence on specific industries – may further shape the distribution of poverty.
Economic and labour market factors
Shifts in labour markets, such as the rise of precarious employment, wage stagnation, and the decline of traditional industries, have unevenly affected different groups of children. Households reliant on low-skilled or part-time employment are particularly vulnerable (Epland & Hattrem, 2023). Furthermore, the type of labour market activity such as self-employment can also shape the extent of risk of poverty (Horemans & Marx, 2024; Sevä & Larsson, 2015). A recent study in Norway shows that self-employment in certain industries carries a particularly high risk of poverty (Brovold, 2025). Educational attainment of the households’ earners has been found to play a more substantial role in shaping child poverty in Sweden and Norway than in the other Nordic countries (Epland & Hattrem, 2023). In addition, economic shocks, such as the 2008 financial crisis (Chzhen, 2017) and the COVID-19 pandemic (Van Lancker & Parolin, 2020), further exposed these vulnerabilities, exacerbating inequalities among specific groups.
Policy variation across the Nordic countries
The Nordic countries share a commitment to comprehensive welfare systems including free education and healthcare, generous parental leave, progressive taxation, and inclusive labour market policies. Such factors contribute to reducing poverty levels (Dalen et al., 2022), but differences in policy design and implementation may contribute to heterogeneity in child poverty rates. For example, variations in unemployment benefits, child allowances, housing subsidies, and tax policies can lead to differences in how effectively each country mitigates child poverty (Eklund Karlsson et al., 2022; Povlsen et al., 2018). Eklund Karlsson et al. (2022) argue that all five Nordic countries implement universal family support policies, including parental leave, child allowances, daycare, and free paediatric healthcare. However, despite these national strategies to reduce child poverty and inequality, challenges such as high housing costs and income disparities persist (Eklund Karlsson et al., 2022). In addition, while all three Scandinavian countries follow national guidelines for regulating the means-tested social assistance schemes, benefit levels in Norway and Sweden can vary based on personal and family circumstances, with Norwegian municipalities granting discretion to set local rates (Dalen et al., 2022). Additionally, the timing and extent of policy changes over the past two decades have created divergent trajectories in poverty trends across the region with higher levels of child poverty emerging in Norway and Sweden (Epland & Hattrem, 2023). Eklund Karlsson et al. (2022) conclude that in some Nordic countries, inequality is rising, likely due to insufficient proportional universalism – where policies exist but lack the necessary scale for vulnerable families. Strengthening local efforts to tackle social disparities is essential for improving policy effectiveness and addressing child poverty (Eklund Karlsson et al., 2022).
2.4 Data and methodology
Comparing household income across countries is a complex task due to variations in data collection practices, income definitions, and units of analysis. However, over the past two decades, efforts toward standardisation have significantly improved the comparability of such data across countries. International guidelines have been established to define the components that should be included in income measurements and to determine the preferred unit of analysis. These guidelines are now widely adopted by national statistical agencies in OECD countries and have also been implemented by international organisations that collect income data from multiple countries, such as the OECD and Eurostat.
This chapter is mostly based on data from Eurostat, the statistical office of the European Union, which provides official indicators of poverty, drawn from the European Union Statistics on Income and Living Conditions (EU-SILC) survey. EU-SILC provides a harmonised framework for cross-national data collection on income, poverty, social exclusion, and living conditions, offering a robust foundation for analysing child poverty. Conducted annually, the survey serves as a key instrument for measuring poverty and inequality across Europe and over time. It gathers detailed household-level information on income, composition, and material deprivation while ensuring comparability through standardised definitions and methodologies across participating countries, including Denmark, Finland, Iceland, Norway, and Sweden. It should be noted that the EU-SILC data is based on representative sample surveys rather than population-wide registry data, which means all estimates are subject to sampling error and statistical uncertainty. Eurostat does not routinely publish confidence intervals for all published indicators. Readers should therefore be aware that differences between countries, subgroups, or time periods – particularly smaller differences – may not be statistically significant. Where possible, we focus on substantive differences that are likely to exceed typical margins of error, but a degree of caution is warranted when interpreting fine-grained comparisons. [4] In addition, for providing an overview at a regional and municipal level we use data on poverty and child poverty from the National Statistical Institutes (NSI’s) of each of the Nordic countries.
The data analysed in this chapter covers the period from 2003 to 2023, enabling an examination of trends over two decades. This time frame includes major economic and social events, such as the 2008 financial crisis and the COVID-19 pandemic, both of which may have had significant impacts on child poverty. The use of EU-SILC data offers several advantages, particularly in terms of comparability and the scope of available variables.
Nonetheless, while data from Eurostat based on EU-SILC is a valuable and robust resource, it is not without limitations. First, although the survey has a longitudinal component, tracking the same households for four years and thereby enabling insights into poverty persistence, the data available through Eurostat does not allow the user to identify households with children. Therefore, it is not possible to examine the persistence of poverty among children in this chapter. Second, while some figures on material deprivation are presented, the chapter primarily focuses on monetary poverty. As a result, it may not fully capture the multidimensional nature of child poverty. Finally, a key data limitation is the absence of data for Iceland from 2019 onward. Consequently, for all figures based on the most recent data, the value used for Iceland is 2019, while 2023 data is applied for the remaining Nordic countries.
When considering the Nordic region, however, EU-SILC data from Eurostat remains the best available source of information to examine and discuss child poverty. These data are reliable and complete, available at the national level, and comparable across the Nordic countries. Therefore, in our project, we have used aggregated data from Eurostat and focus on the following key indicators:
- At-risk-of-poverty rate (AROP) 60%: The proportion of individuals residing in households with an equivalised disposable income below 60% of the national median income after social transfers serves as a key measure of poverty (Eurostat, n.d.-b). In the context of child poverty, this indicator reflects the percentage of children experiencing such economic conditions relative to the total population of children. It is the most widely used and standardised metric in the literature for assessing relative poverty.
- At-risk-of-poverty rate before social transfers: This indicator is defined as the proportion of individuals residing in households with an equivalised disposable income below 60% of the national median, calculated prior to the inclusion of social transfers. In essence, this indicator estimates what household income levels would be in the absence of governmental support through social transfers. It should also be noted that pensions, such as old-age and survivors’ (widows’ and widowers’) pensions are counted as income (before social transfers) and not as social transfers.
- At-risk-of-poverty rate (AROP) 50%: The proportion of individuals residing in households with an equivalised disposable income below 50% of the national median serves as an indicator of deeper income poverty. This indicator applies a stricter relative income threshold (50 % of median). It is not an official EU category, but is used in research to identify a subgroup with deeper income poverty relative to the standard EU 60 % threshold
- Material deprivation rate: The material deprivation rate, as defined by the EU-SILC, measures the extent to which individuals lack the financial means to obtain goods and services generally regarded as essential for a decent standard of living. This indicator differentiates between those who are unable to afford specific items and those who do not possess them for other reasons, such as personal preference or lack of necessity. In this chapter it refers to the percentage of children growing in an household which is experiencing a lack of essential items and services (Eurostat, n.d.-e). It should be noted that Eurostat provides information on the child-specific deprivation rate, but the information is available just for 2021 and 2024. Therefore, we have opted to use the social and material variable which is defined by the information on parents (see also Glossary: Material deprivation (Eurostat, n.d.-e) and Glossary: Child deprivation (Eurostat, n.d.-c)).
2.5 Results
Poverty and child poverty in the Nordics: Indicators and overtime trends
Figure 1 illustrates the at-risk-of-poverty (AROP) rates for the full population, measured as a percentage of households falling below 60% of the median equivalised income after social transfers across the EU (from 2020 the EU-27 value excludes the UK), and Nordic countries from 2003 to 2023. The EU consistently shows higher poverty rates compared to the Nordic countries, with levels hovering around 16% to 17% throughout the observed period. In contrast, the Nordic countries exhibit notably lower AROP, which may be related to their social welfare systems, and lower level of economic inequality. The Nordic countries provide more extensive cash transfers and a higher level of social security, which increases the disposable income of those at risk of poverty to a greater extent. Among the Nordics, Denmark, Finland, and Norway maintained relatively stable and low poverty rates, generally ranging between 10% and 13%, but with somewhat higher levels of poverty in Finland during the economic crisis of 2008. Iceland had the lowest poverty rates in the group, remaining below 10% for most of the time frame. Sweden stands out with rising AROP rates during the period, at around 10–12% in the early 2000s, surpassing the EU levels in 2017, reaching 17%, and then stabilising at about 16%. The deviation of Sweden from the rest of the Nordics in recent years alongside the situation of Finland around the crises highlights the importance of looking at long time trends. At the same time, the clear gap between most Nordic countries and the EU average may underscore the role of comprehensive social policies in reducing poverty, making the Nordics a compelling model in discussions on addressing poverty in general and child poverty specifically. Figure A in the Appendix shows the same results using the 50% of the median equivalised income threshold. This figure mirrors to a large extent the results shown in figure 1 for the case of deeper poverty.
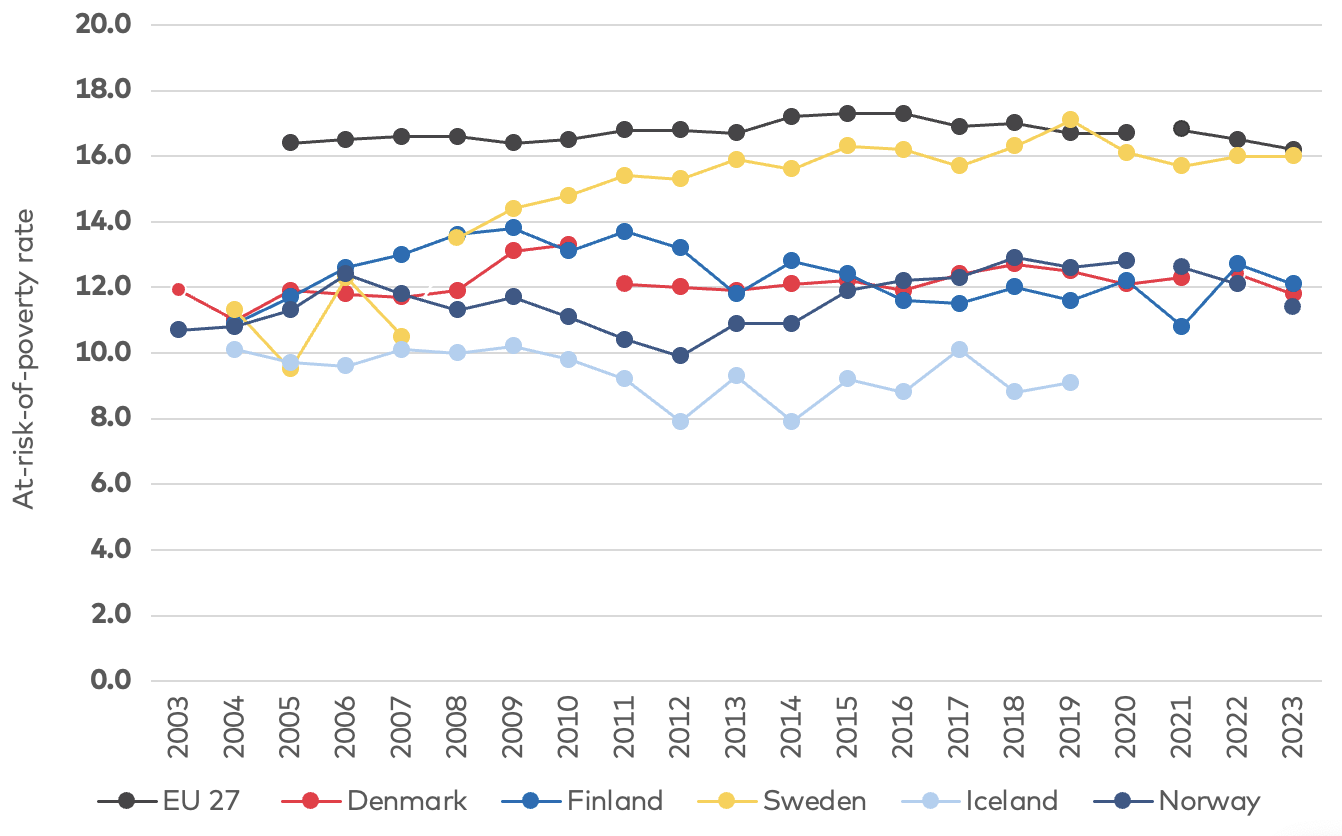
Figure 1: Risk of poverty (% of households) by country and time: 60% of median equivalised income
Source: Eurostat (2024b). At-risk-of-poverty rate by poverty threshold and household type (ILC_LI03) . Note: Data points that appear unconnected by lines indicate a break in the time series.
While Figure 1 illustrates trends in poverty risk over time, it is also important to consider how these risks vary across different age groups. Figure 2 presents the at-risk-of-poverty rates in 2023 for various age groups in the EU and in the Nordics, using the 60% threshold previously discussed. The data highlight variations across countries to the extent to which poverty risks differ by age group. In Denmark, Finland, and Norway, poverty rates are relatively evenly distributed across age groups, with only minor differences between children, working-age adults, and the elderly. In Finland, and to some extent also in Denmark, the level of child poverty is slightly lower than the overall poverty rate. Previous research has suggested that Finland is among the few countries in the OECD exhibiting this pattern (Adamson, 2012), partially due to the implementation of universal child benefits and other family support programmes (Obućina & Ilmakunnas, 2020).
By contrast, Sweden exhibits a markedly different pattern, with children under six years old and those under 18 facing a markedly higher risk of poverty than other age groups. The at-risk-of-poverty rate for young children exceeds 20%, surpassing that of both working-age adults and the elderly. This trend is consistent with broader patterns observed in the EU. A somewhat similar pattern is evident in Iceland, where young children (under six years old) experience the highest poverty rates, followed by children under 18. In Iceland, both of these categories exceed the poverty levels of the total population. Notably, in both Iceland and Norway, individuals aged 65 and over experience substantially lower poverty rates compared to the total population.
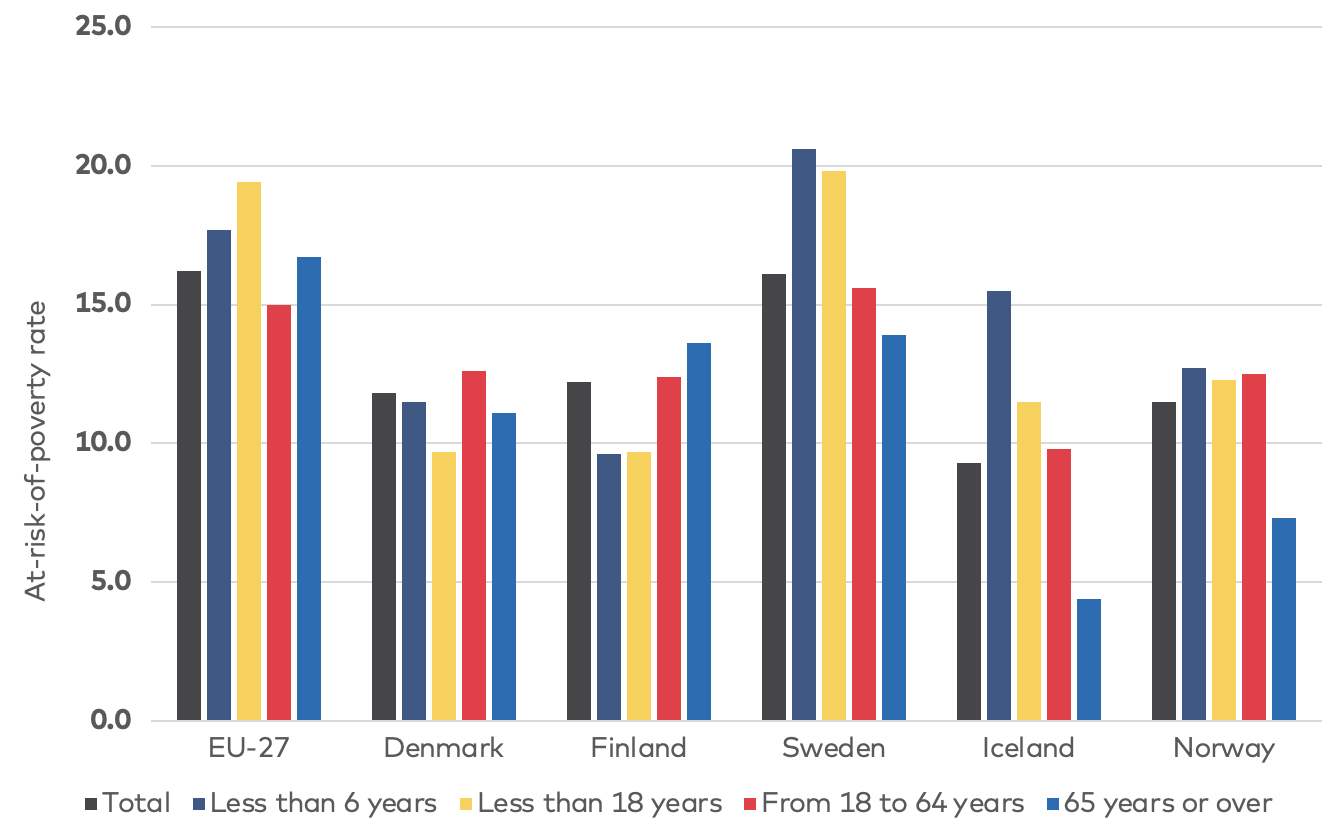
Figure 2: At-risk-of-poverty rate by poverty threshold, age group, 2023. 60% of median equivalised income
Source: Eurostat (2024a). At-risk-of-poverty rate by poverty threshold, age, and sex (ILC_LI02).
Note: Values for Iceland are based on 2019, the last available data.
Note: Values for Iceland are based on 2019, the last available data.
Figures 3 and 4 depict how the at risk of poverty for children (i.e., individuals less than 18 years old) has developed over time, using both the 50% and 60% threshold of median equivalised income. Figure 3 applies a threshold of 60% of median equivalised income after social transfers, which is the standard measurement used by Eurostat. This indicator captures a broader group of individuals at risk of poverty and offers a more comprehensive assessment of economic vulnerability. In contrast, Figure 4 adopts a stricter threshold of 50% of median equivalised income after social transfers, identifying individuals who experience severe financial hardship (which is also the indicator used by The OECD in their reports on poverty (OECD, 2024)). The implications of these calculations are meaningful: while the 50% threshold emphasises deeper income poverty and helps identify those in urgent need of support, the 60% threshold provides a broader perspective on financial insecurity within society.
Figure 3 shows that the EU maintains higher poverty rates among children – consistently around 20% – compared to the Nordic countries. Among the Nordic nations, Sweden demonstrates an upward trend, starting at levels similar to the rest of the region (approximately 10–12%) but peaking at 22% in 2021, indicating a notable increase of children’s at-risk-of-poverty over time. This implies that one in five children in Sweden lived in households at risk of poverty in 2023. Norway also exhibits a gradual rise from 2014 onward, stabilising at around 14% in 2019 before experiencing a slight decline between 2021 and 2023, yet remaining at higher levels than Denmark and Finland. Meanwhile, Denmark, Finland, and Iceland demonstrate more stable and lower child AROP rates ranging between 9% and 12% for most of the period.
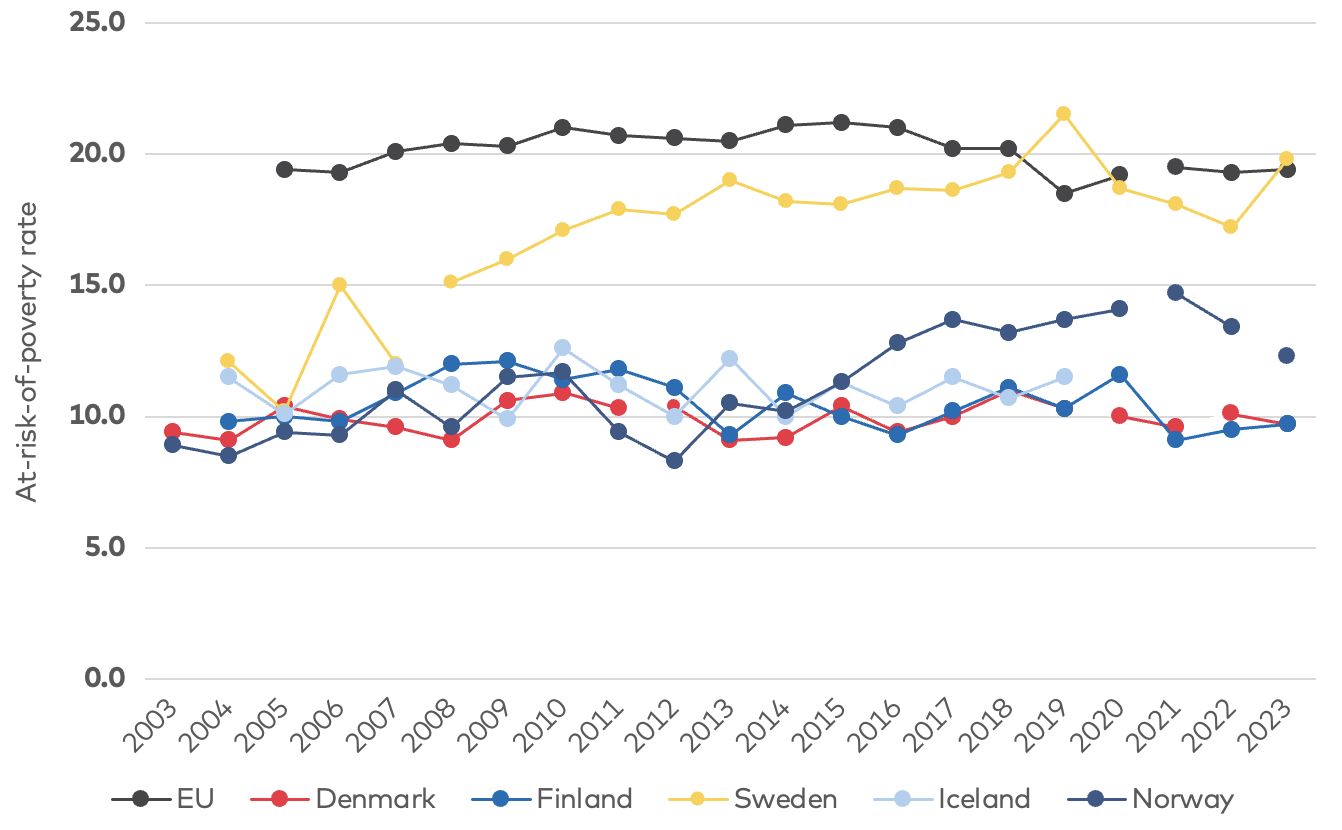
Figure 3: At-risk-of-poverty rate by reporting country and year: Less than 18 years cut-off point: 60% of median equivalised income after social transfers
Source: Eurostat (2024b). At-risk-of-poverty rate by poverty threshold, age, and sex (ILC_LI02).
Note: Data points that appear unconnected by lines indicate a break in the time series.
Note: Data points that appear unconnected by lines indicate a break in the time series.
Figure 4 illustrates the at-risk-of-poverty indicator for children, using a threshold defined as 50% of the median equivalised income. This indicator captures deeper relative income poverty. The 50 % threshold is included here as a stricter relative income threshold, commonly used in poverty research to highlight deeper income disadvantages. It is not an official EU category but serves as an analytical tool to complement the standard EU 60 % measure. The EU exhibits higher AROP levels than the Nordic countries, generally ranging between 12% and 14%, with slightly elevated levels between 2014 and 2016. Similar to the previous indicator, most Nordic countries report a lower share of children at risk of poverty compared to the EU, with figures ranging between 3.5% and 8.7%. Sweden stands out with a higher rate throughout most of the period, reaching levels comparable to the EU in more recent years. Norway also experienced an increase in severe child poverty risk between 2012 and 2021, rising from 3.9% – the lowest level among the Nordic countries in 2012 – to 8.7% in 2021, followed by a decline to 6.5% in 2023. In contrast, Denmark, Finland, and Iceland remain below 6.5%, displaying a relatively stable trend over the observed period. A comparison of the two figures reveals similar trends over time across both indicators, suggesting lower AROP levels for children in most Nordic countries relative to the EU. However, Sweden’s upward trajectory highlights emerging disparities between the Nordic countries, indicating potential challenges in sustaining historically low poverty rates – particularly when considering that this figure focuses on the at risk of poverty rate after transfer payments.
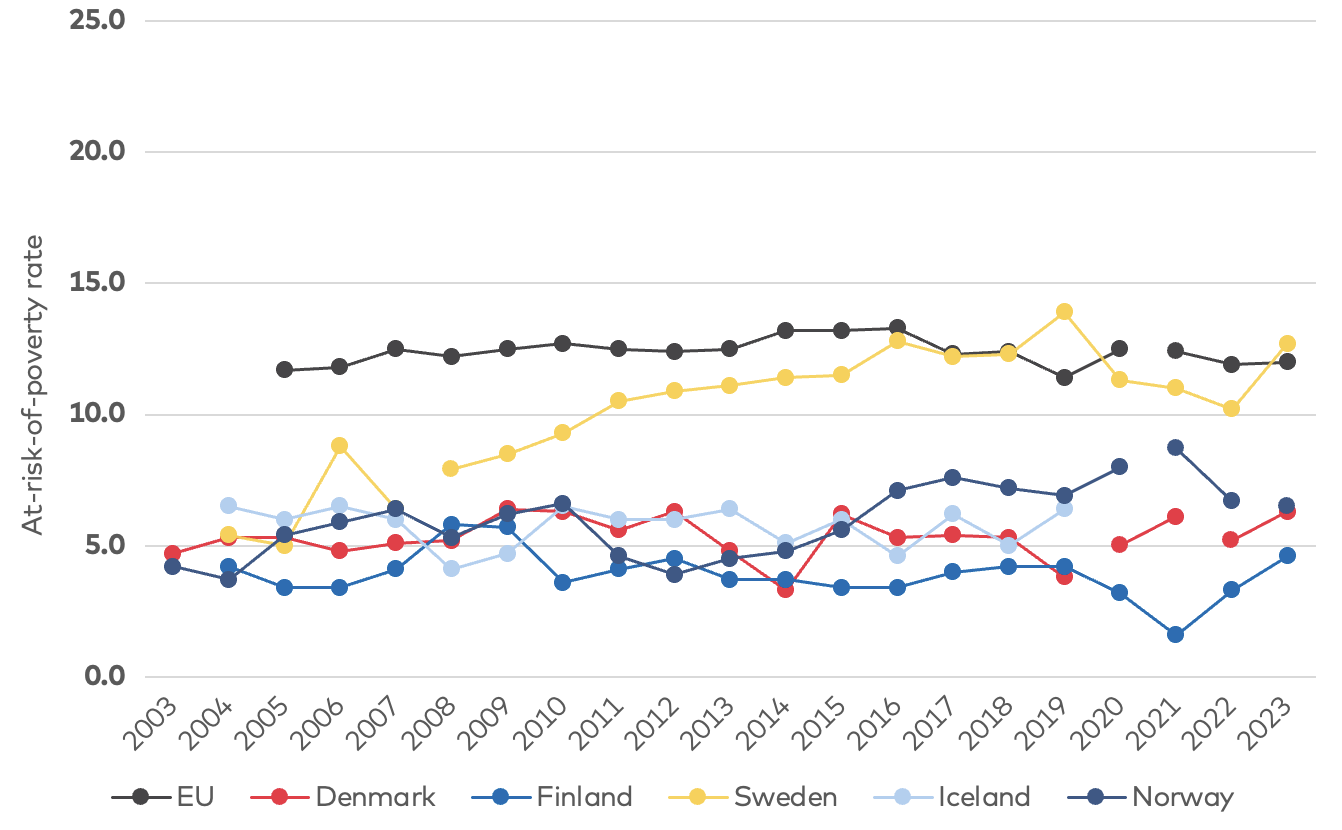
Figure 4: At-risk-of-poverty rate by reporting country and year: Less than 18 years cut-off point: 50% of median equivalised income after social transfers
Source: Eurostat (2024a). At-risk-of-poverty rate by poverty threshold, age, and sex (ILC_LI02).
Note: Data points that appear unconnected by lines indicate a break in the time series.
Note: Data points that appear unconnected by lines indicate a break in the time series.
The role of social transfers
Figure 5 compares child poverty rates before and after social transfers in 2023 across the EU and the Nordic countries. It presents at-risk-of-poverty rates both before and after social transfers, using two different poverty thresholds: 50% of median equivalised income (deeper income poverty) and 60% of median equivalised income (poverty). This comparison highlights the role of welfare policies in poverty reduction by contrasting a hypothetical scenario in which the state does not intervene – allowing market forces to determine children’s (and households’) economic conditions – with the actual situation, where children and families receive transfer payments.
Using the 60% threshold, which captures overall poverty, and comparing values before and after social transfers, child poverty rates are significantly higher across all countries before social transfers. Among the Nordic countries, Sweden (32.9%) and Finland (27.7%) record the highest pre-transfer child poverty rates, with Sweden reaching levels that nearly align with the EU average. The impact of social transfers on poverty reduction is most pronounced in Finland, Iceland, and Denmark, where at-risk-of-poverty rates decline by 18, 14.9, and 13.4 percentage points, respectively. While social transfers substantially reduce poverty rates in all countries, Sweden continues to report a relatively high post-transfer poverty rate (19.8%), exceeding the EU average in 2023. Norway exhibits the second-lowest pre-transfer child poverty rate (22.0%); however, following social transfers, it has the second highest at-risk-of-poverty rate among children. This outcome reflects a relatively modest reduction in child poverty as a result of transfer payments compared to Denmark, Finland, and Iceland.
Focusing on the 50% threshold, it is evident that before social transfers, severe child poverty rates are substantially higher compared to post-transfer levels, underscoring the role of social transfers. In particular, Sweden (25.9%), Finland (20.4%), Iceland (18.3%), and Denmark (17.1%) exhibit notably high pre-transfer poverty rates under this threshold. After social transfers, the AROP rate declines substantially, with Finland experiencing a reduction of nearly 16% points. However, Sweden shows a different pattern in the Nordic context under this threshold, with post-transfer poverty rates of 12.7% – the highest among the Nordic countries – despite a 13.2%-point reduction due to social transfers. Sweden’s persistently high post-transfer poverty rate may be attributable to its exceptionally high pre-transfer level (25.9%). As a result, Sweden’s AROP rate closely aligns with the EU average (12.0%), diverging from the rest of the Nordic countries, all of which hold deeper income poverty rates below 7%.
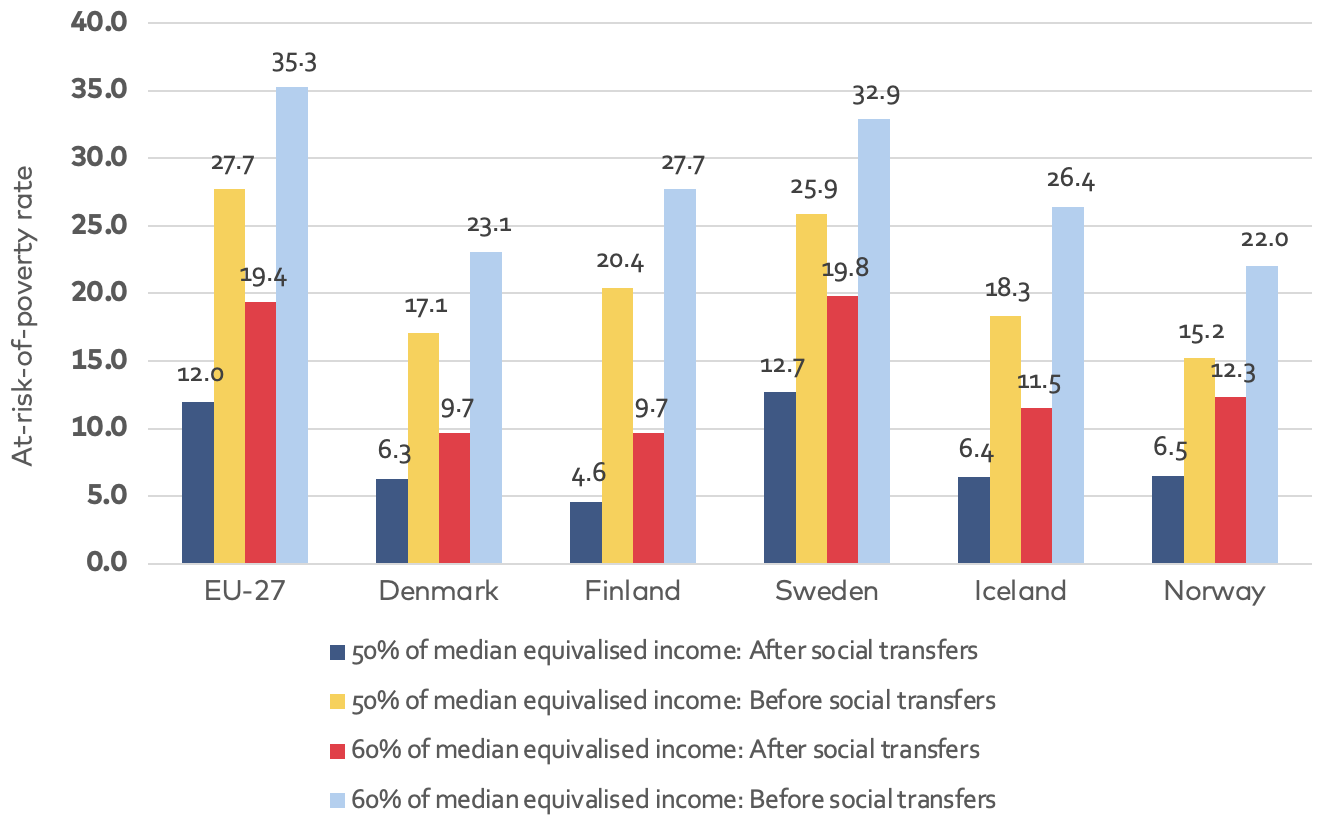
Figure 5: At-risk-of-poverty rate before and after social transfers by country, 2023: Individuals under 18 years, 50% and 60% median equivalised income treshold
Source: Eurostat (2024b). At-risk-of-poverty rate before social transfers (pensions included in social transfers) by poverty threshold, age, and sex (ILC_LI09) and Eurostat (2024a). At-risk-of-poverty rate by poverty threshold, age, and sex (ILC_LI02). Note: Values for Iceland are based on 2019, the last available data.
Figure 5 clearly highlights the difference between Sweden, and to some extent Norway, and the other Nordic countries in reducing child poverty by social transfers. This raises critical questions on the temporal aspects of this divergence: at what point did the gap between Sweden and the other Nordic countries emerge, and when did a similar shift occur in Norway? Furthermore, it remains uncertain whether Sweden’s widening disparity is driven by an increase in poverty levels before the redistribution of social transfers or by a rise in median income, which may result in a greater proportion of children falling below the poverty threshold.
Figures 6A and 6B seek to shed some light into these dynamics by presenting poverty rates between 2003 and 2023 before and after social transfers, using 60% of the median income as the threshold, alongside the median equivalised income (MEI). Figure 6A focuses on Denmark and Finland, while Figure 6B examines Norway and Sweden. Iceland is not included in the figures due to the unavailability of data since 2019.
The figure of Denmark and Finland indicates that, over time, child poverty rates after social transfers have remained relatively stable, at 10–12%. However, there is variation in pre-transfer poverty rates in each country. Notably, Finland progressively reduced the gap created by market-driven inequalities, achieving comparable post-transfer child poverty rates to those in Denmark despite initially higher levels of market-driven poverty. Moreover, the data indicates that despite rising median wages in both countries, the proportion of children living below the poverty line remained constant. This stability may be explained by two factors: either income growth among lower-income households has kept pace with broader income increases, thereby mitigating income disparities, or social transfers are indexed to income growth, ensuring that lower-income children maintain a relatively stable position within the income distribution.
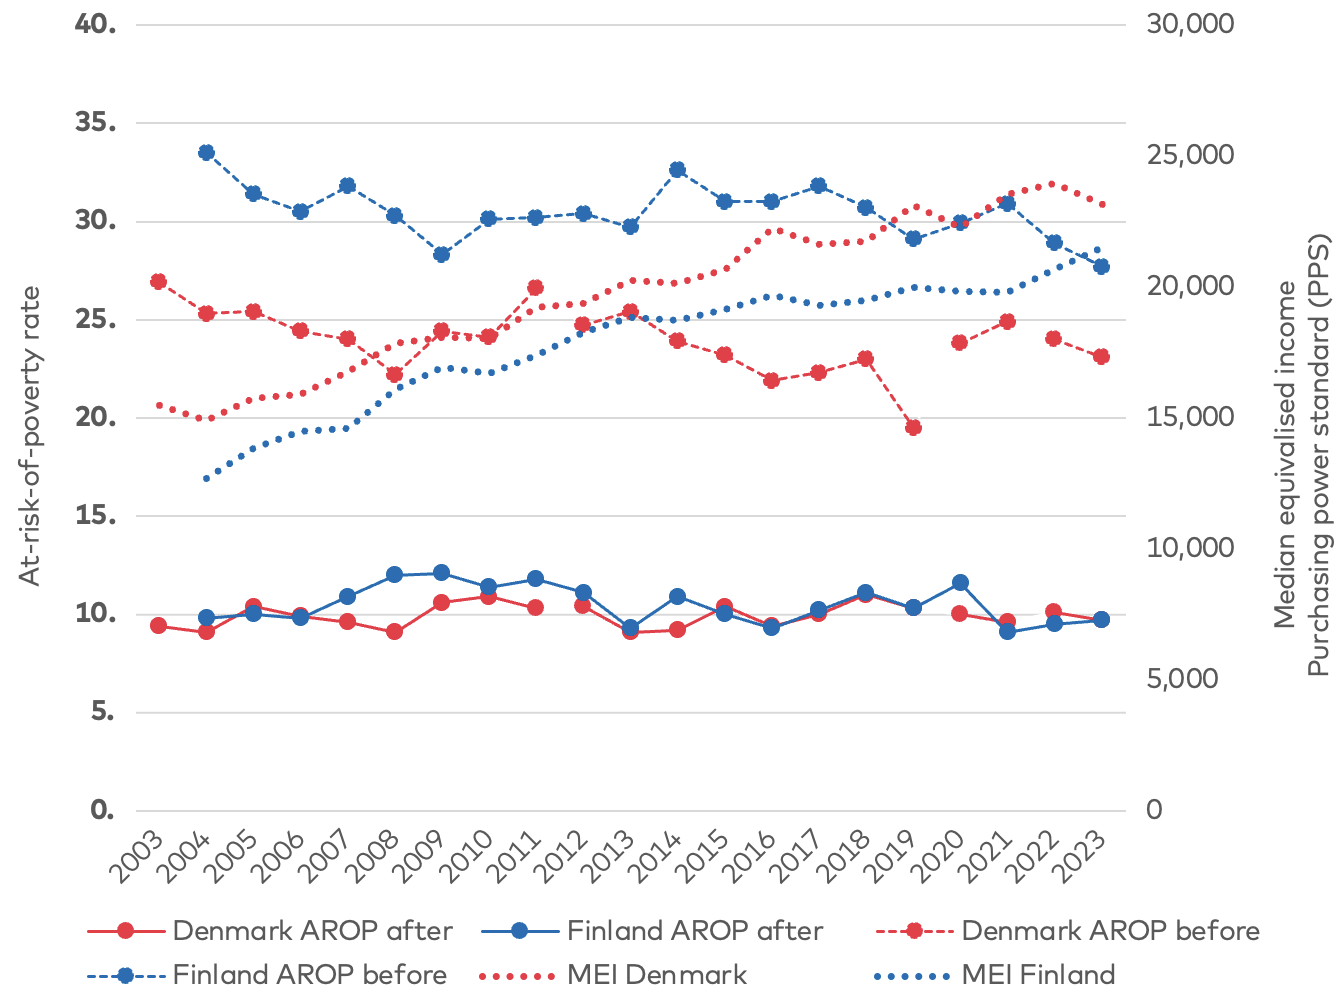
Figure 6A: Median equivalised income and at-risk-of-poverty rate before and after transfer payment, 60% of median equivalised income. Individuals under 18, Denmark, Finland, and EU
Source: Eurostat (2024b). At-risk-of-poverty rate before social transfers (pensions included in social transfers) by poverty threshold, age, and sex (ILC_LI09) and Eurostat (2024a) At-risk-of-poverty rate by poverty threshold, age, and sex (ILC_LI02). Note: Data points that appear unconnected by lines indicate a break in the time series.
Figure 6B presents comparable findings for Norway and Sweden, highlighting key differences between Sweden and the other Nordic countries while also indicating that, to some extent, Norway follows a similar trajectory as Sweden. In Sweden, the at risk of poverty before social transfer has remained at or above 35% during most of the time period covered here. However, pre-transfer poverty levels show no clear upward trajectory. The at-risk-of-poverty rate after social transfers, on the other hand, exhibits an upward trend that has not kept pace with the growth in median equivalised income. This suggests that while median income has increased, a larger proportion of children remains at-risk-of-poverty after social transfers, indicating that the benefits of economic growth may not have been evenly distributed.
Furthermore, the divergence between rising median income and increasing poverty rates after social transfers may reflect changes in how social transfers address the needs of vulnerable children. It is important to note that families can fall below the poverty threshold without an actual decline in household income, as the relative poverty measure is tied to median income. As median income rises, the poverty threshold increases accordingly, which can result in more children being classified as at risk of poverty even if their household income remains stable. At the same time, this pattern suggests that income growth has been uneven, with more families with children below the poverty line, who may now experience a greater economic disparity relative to their peers, exacerbating social inequality.
In Norway, the poverty threshold before social transfers has remained below the EU average over time and has exhibited greater volatility than in Sweden. While Norway has also experienced an upward trend in child poverty after social transfers, the increase has been less pronounced than in Sweden but should not be neglected. Additionally, poverty rates after social transfers in Norway appear to follow pre-transfer poverty levels more closely than median income. This pattern suggests different relationships between social transfers and child poverty outcomes in the two countries. Norway’s income growth may have been accompanied by gains across a wider range of households, including those in the lower part of the income distribution, which could contribute to lower relative poverty rates for children.
It is essential to recognise that this assessment adopts a broad perspective, and comparing Nordic countries solely based on the impact of social transfers provides only a partial understanding. This limitation arises because social transfers do not account for variations in non-monetary support that children receive across different countries. A notable example includes differences in school-provided nutritional programmes, and other essential welfare provisions (Eklund Karlsson et al., 2022). In addition, this chapter primarily focuses on relative poverty, rather than absolute poverty, which may present a different pattern. Nevertheless, despite these limitations, the overall picture regarding the trends in AROP over time remains relatively clear.
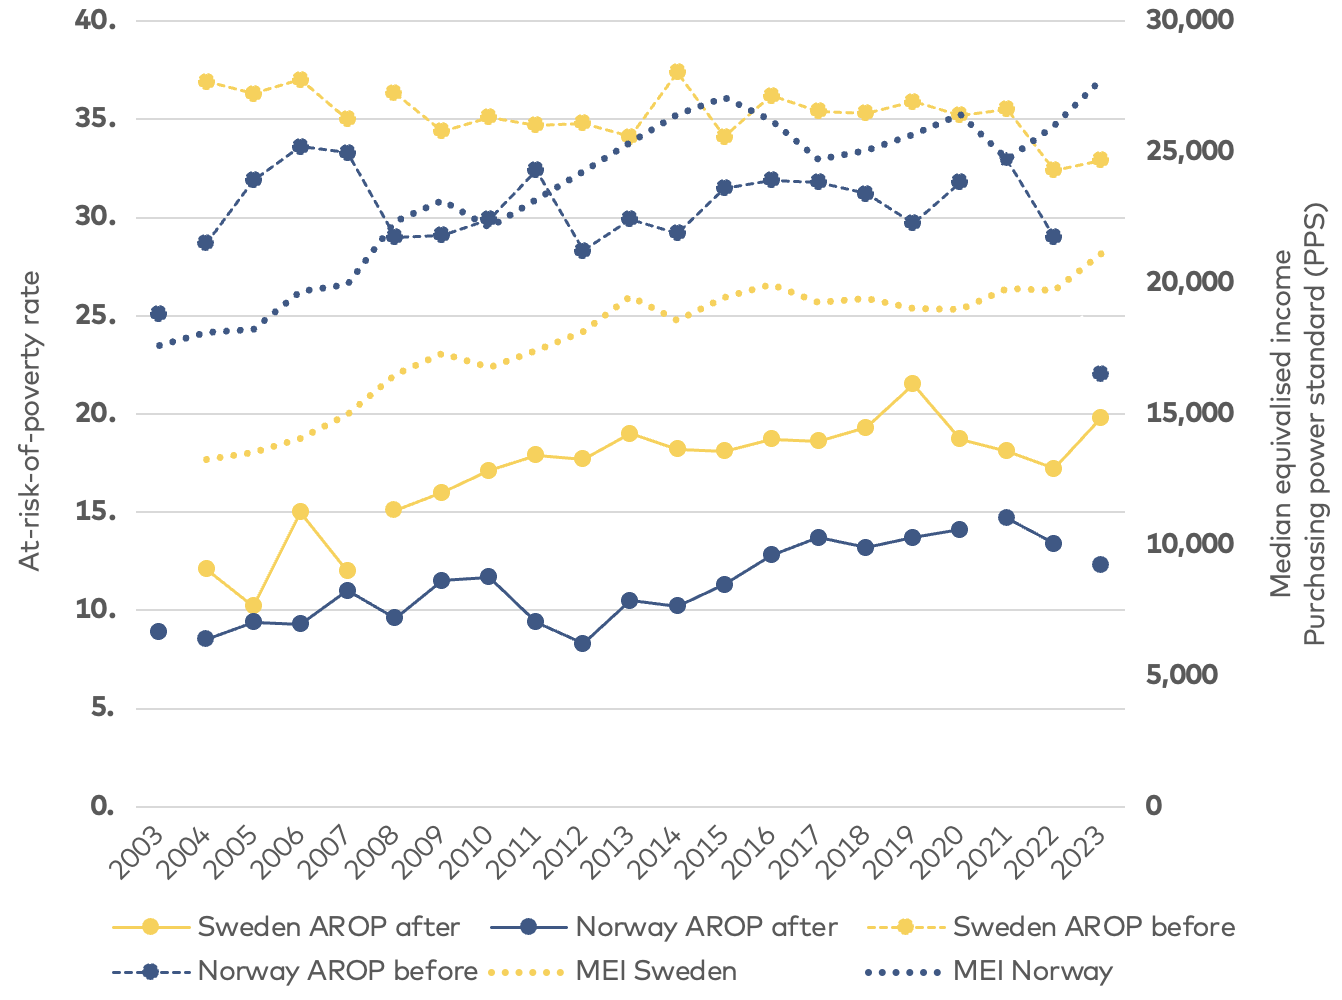
Figure 6B: Median equivalised income and at-risk-of-poverty rate before and after transfer payments, 60% of median equivalised income. Individuals under 18, Sweden, Norway, and EU
Source: Eurostat (2024b). At-risk-of-poverty rate before social transfers (pensions included in social transfers) by poverty threshold, age, and sex (ILC_LI09) and Eurostat (2024a). At-risk-of-poverty rate by poverty threshold, age, and sex (ILC_LI02). Note: Data points that appear unconnected by lines indicate a break in the time series.
The previous section analysed long-term trends and indicated a stable AROP rate in Denmark, Finland, and Iceland for both the overall population and for children. However, in Sweden and, to some extent, Norway, an upward trend in the AROP rate was observed. The following section examines which groups of children are most vulnerable to poverty, their geographical distribution, and the characteristics of their households.
Regional differences in at-risk-of-poverty rate
Map 1 presents child AROP levels for Sweden, Norway, Finland, and Iceland, from which several key findings emerge. In Denmark, the 50% threshold indicator is the only available measure of AROP at the municipal level for children, which differs from the other Nordic countries. We therefore decided to omit Denmark from the map. Examining intra-country variations, we found that Finland had the lowest levels of child AROP in 2023, recorded at 9.7% at the national level. However, the mean across municipalities stood at 13.5%, highlighting the geographic concentration of poverty in specific areas. Several municipalities in Finland had high child AROP s, exceeding 25% among children aged 0–17 years. These municipalities include Merijärvi (29.1%), Sievi (26.3%), Miehikkälä (26.1%), Perho (25.6%), and Utsjoki (25.0%). All of these municipalities are classified as rural areas with over 30% of the working-age population having low levels of education.
For more statistical indicators at the municipality level see Digital inclusion
In 2023, Iceland recorded the second-lowest level of child poverty among the Nordic countries, with a national at-risk-of-poverty rate of 11.5%. However, due to data limitations, it is not possible to assess variation at the municipal level, as Iceland reports child poverty rates only for the capital region and the rest of the country.
In Norway, the national rate of children at risk of poverty stood at 12.3%, while the mean across municipalities was 13.1%. Several municipalities exhibited a significantly higher AROP rate among children, exceeding 25%, including Våler (Innlandet) (30.3%), Beiarn (29.4%), Rendalen (28.2%), Hjartdal (26.1%), Loabák – Lavangen (25.1%), Nore og Uvdal (25.0%), and Værøy (25.0%). Similar to Finland, all of these municipalities are rural and characterised by a high proportion of individuals with low educational attainment (above 25%). Additionally, in all of these municipalities, more than 20% of the population are children under the age of 14. Moreover, in four of these municipalities, over 10% of the population have a foreign background.
Finally, the case of Sweden reveals a significantly higher incidence of child poverty compared to the other Nordic countries. In nearly 17% of Swedish municipalities (49 out of 290), child poverty rates exceeded 25%. The average rate of child poverty across municipalities is 18%, while the national average stands at 19.8%. Municipalities with exceptionally high concentrations of child poverty, where rates exceed 30%, are primarily located in the central and southern part of Sweden. These municipalities include Hällefors (38.6%), Högsby (37.6%), Perstorp (37.3%), Flen (36.0%), Filipstad (34.6%), Lessebo (33.0%), Gullspång (32.1%), Bräcke (31.4%), Fagersta (30.7%), and Ljusnarsberg (30.6%). Most of these municipalities are rural (8 out of 10), with the proportion of individuals with low levels of education exceeding 27% in nearly all cases and relatively high unemployment rates. Additionally, many of these municipalities have a significant share of individuals with a foreign background, ranging from 26% to 45%. Bräcke is somewhat of an exception, as the proportion of migrants is 19.3%, and the percentage of individuals with low levels of education is relatively modest at 23.4%.
Overall, these findings indicate significant geographic disparities in child AROP across the Nordic countries. Rural areas generally show higher rates of child AROP, particularly in Sweden and Finland.
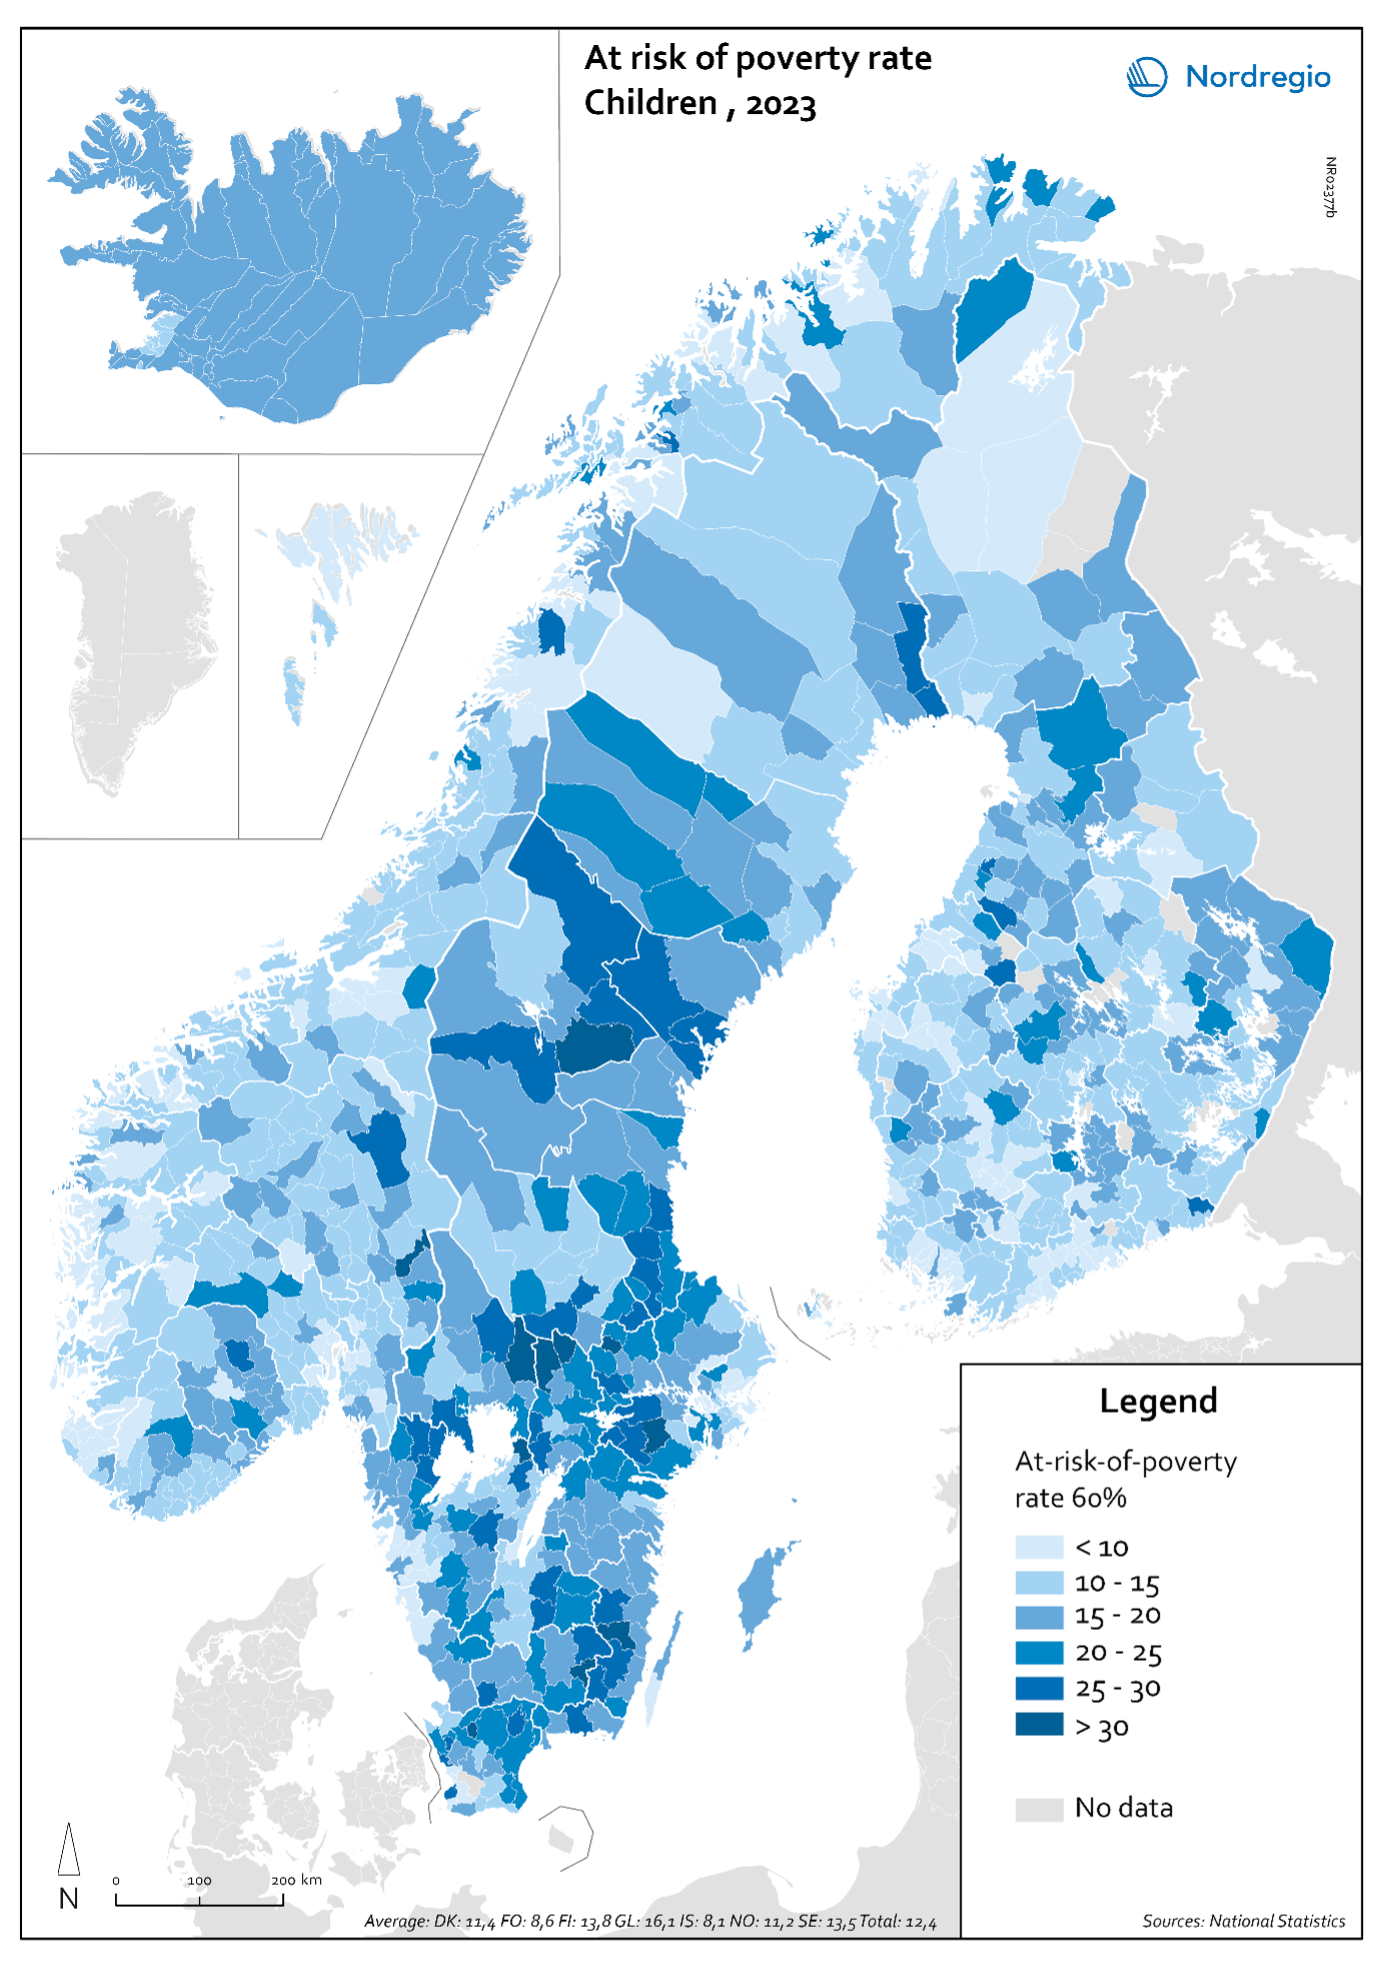
Map 1: Child AROP levels (60%) by municipality in Sweden, Norway, Finland, and Iceland, 2021
Source: National Statistical Institutes: Statistics Norway (2025), Statistics Sweden (2025), Statistics Faroe Islands (2025), Statistics Iceland (2025), Statistics Finland (2025). Note: In Denmark, the 50% threshold indicator is the only available measure of AROP at the municipal level for children and therefore Denmark is omitted from the map.
Household composition
Household structure plays a pivotal role in shaping the at-risk-of-poverty among children. The academic literature suggests that children in single-parent households face a substantially higher risk of poverty compared to those in two-parent families (Bostic, 2023; Gornick & Jäntti, 2011; Young Håkansson, 2024a). Similarly, relative to smaller families, children growing up in large families also have a higher risk of poverty (Gornick & Jäntti, 2011).
Figure 7 illustrates the at-risk-of-poverty rates after social transfers in 2023, with 2013 levels indicated by black diamonds. These rates are measured at 60% of the median equivalised income and are categorised by household type. When comparing the overall at-risk-of-poverty rate of the total population to that of households with children, the differences appear relatively small. However, disaggregating the data by household composition reveals substantial disparities across all Nordic countries. Households with two adults and up to two children exhibit significantly lower poverty risks compared to other household types. In contrast, single-parent households with dependent children consistently display the highest at-risk-of-poverty rates in most Nordic countries, exceeding 20% in all countries. Notably, Norway and Sweden report particularly high levels, approaching rates comparable to the EU average of 32%. Similarly, households with three or more dependent children face significantly higher poverty risks than those with only two children. An interesting pattern emerges in Sweden, where large families, rather than single-parent households, exhibit the highest poverty risk.
Over the decade between 2013 to 2023, the AROP for children growing up in single-parent households declined in Finland, Iceland, and Sweden, and increased in Denmark and, to a lesser extent, in Norway. Simultaneously, the at risk of poverty rose by 7–8% points in Sweden and in Norway for children growing up in large families. This underscores that, although the Nordic countries generally maintain lower overall AROP rates compared to the EU levels, substantial disparities persist among different household types. In particular, some of the most disadvantaged households, such as large families in Sweden and Norway, have experienced an increase in poverty levels, as have single-parent households in Denmark.
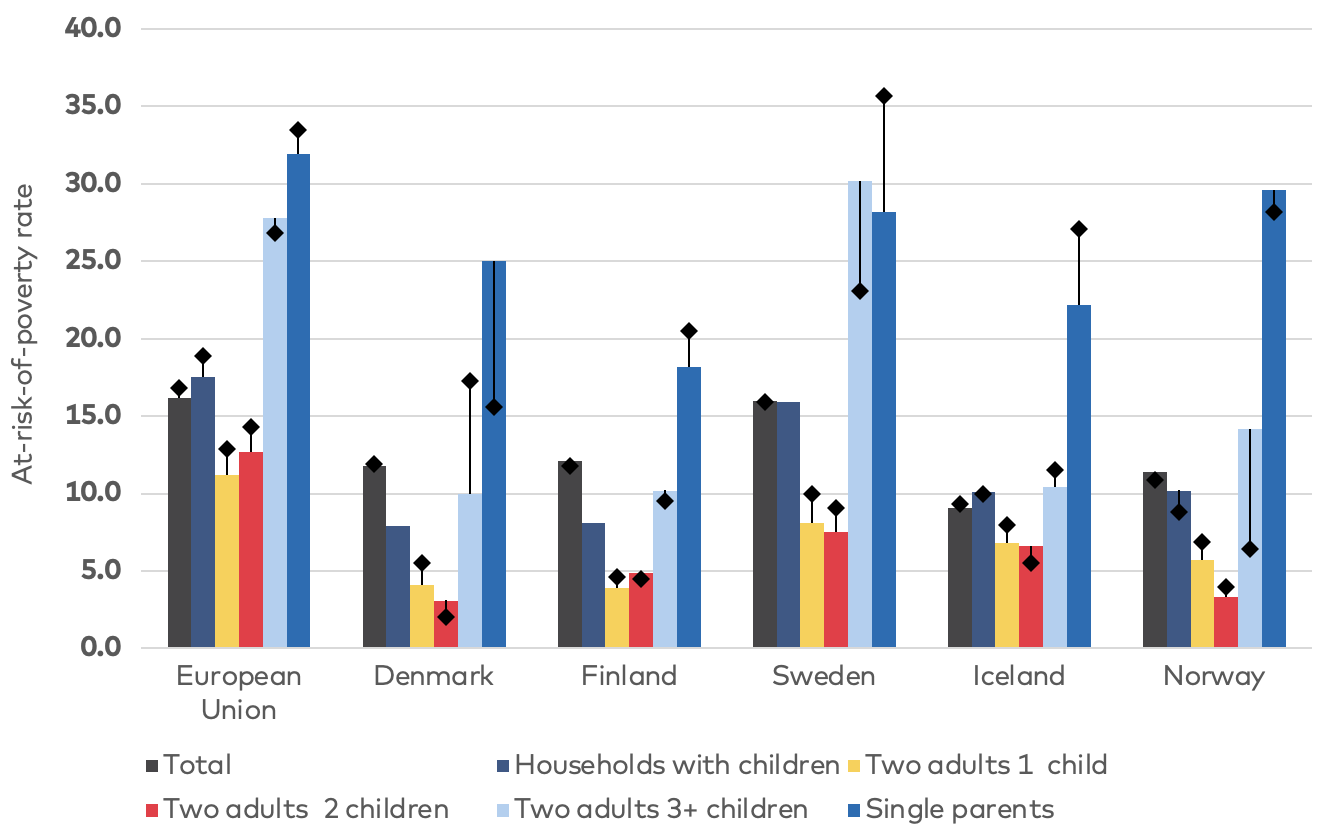
Figure 7: At-risk-of-poverty rate by household type, 2023 and 2013, cut-off point: 60% of median equivalised income after social transfers
Columns: 2023 / Dots: 2014
Source: Eurostat (2024b). At-risk-of-poverty rate by household type (ILC_LI03). Note: Values for Iceland are based on 2019, the last available data.
Building on the discussion of how social transfers relate to child poverty rates, and the variations in poverty risk among different household types shown in Figure 7, an important question emerges: How do these payments correspond to poverty outcomes across various household categories? The results of this assessment are displayed in Figure 8, which presents the at-risk-of-poverty rates before and after social transfers in 2023, measured at 60% of the median equivalised income by household type. The primary objective of this figure is to illustrate the relationship between social transfers and poverty risk.
Nordic countries generally exhibit somewhat lower overall poverty risks before social transfers compared to the EU average for most household types. The redistribution of income through social transfers reduces at-risk-of-poverty rates by approximately 26 percentage points – a level of redistribution comparable to that observed in the EU as a whole – resulting in lower post-transfer poverty levels. In most countries, single-parent households with dependent children consistently experience the highest at-risk-of-poverty rates before social transfers, ranging from 41% to 56%, with particularly high levels in Denmark (56%). Households with three or more dependent children also face significantly higher pre-transfer poverty risks compared to households with two children, particularly in Sweden (47%) and Finland (32%).
A comparison of poverty risks before and after social transfers shows that the largest reductions in poverty rates have taken place among single-parent households in most countries, with the notable exception of Sweden. Comparing Denmark and Finland with Sweden highlights this difference: while single-parent poverty rates in Denmark and Finland were higher before social transfers, they decline substantially post-transfer, whereas Sweden and Norway continue to report relatively high levels. In fact, the redistributive effect for the most disadvantaged groups (single parents and large families) appears more modest in Sweden relative to the other Nordic countries and even relative to the EU average, leaving these groups particularly vulnerable.
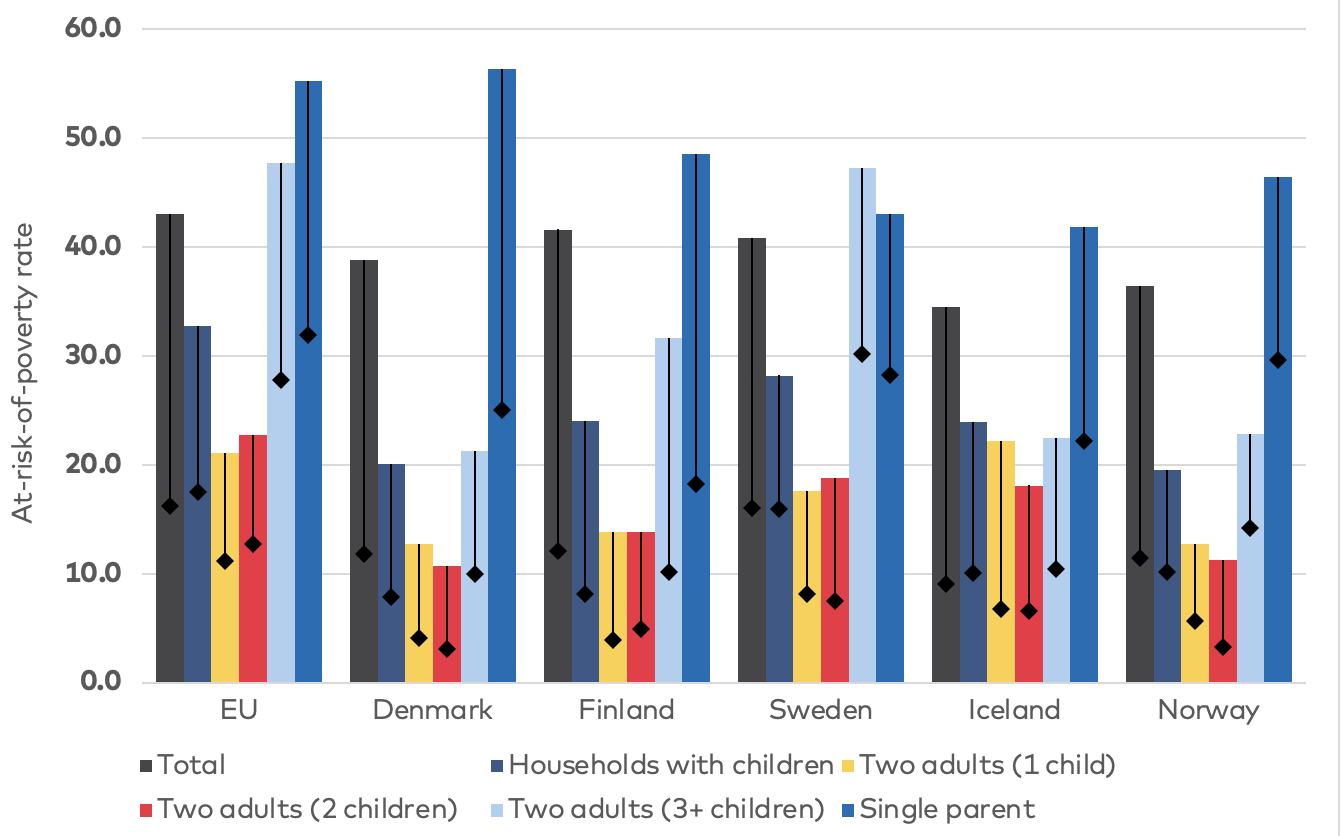
Figure 8: At-risk-of-poverty rate before (columns) and after (dots) social transfers by household type, 2023: 60% of median equivalised income
Columns: Before / Dots: After
Source: Eurostat (2024b). At-risk-of-poverty rate by household type (ILC_LI03) and Eurostat (2025a). At-risk-of-poverty rate before social transfers (pensions included in social transfers) by household type (ILC_LI09B). Note: 1) Values for Iceland are based on 2019, the last available data. 2) Pensions included in social transfers
Figure 9 illustrates the material and social deprivation rates by household type in the EU and Nordic countries for the years 2014 (the earliest available data point, represented by the black diamonds) and 2023, allowing for a comparison of changes over time. Consistent with the findings on poverty rates, the results indicate that single-parent households experience the highest levels of deprivation across all regions. The EU averages remain higher than those observed in the Nordic countries, where overall deprivation rates are comparatively lower.
The material and social deprivation rates indicator provides a broader measurement of deprivation and social exclusion. Unlike the findings on relative poverty, as reflected in the AROP (above), Sweden reports lower levels on this indicator compared to other Nordic countries. These discrepancies may be attributed to variations in the prices of goods across the Nordic region. Furthermore, while material and social deprivation rates have remained stable or shown slight improvements for most household types since 2014, deprivation among single-parent households has increased in all Nordic countries except Iceland.
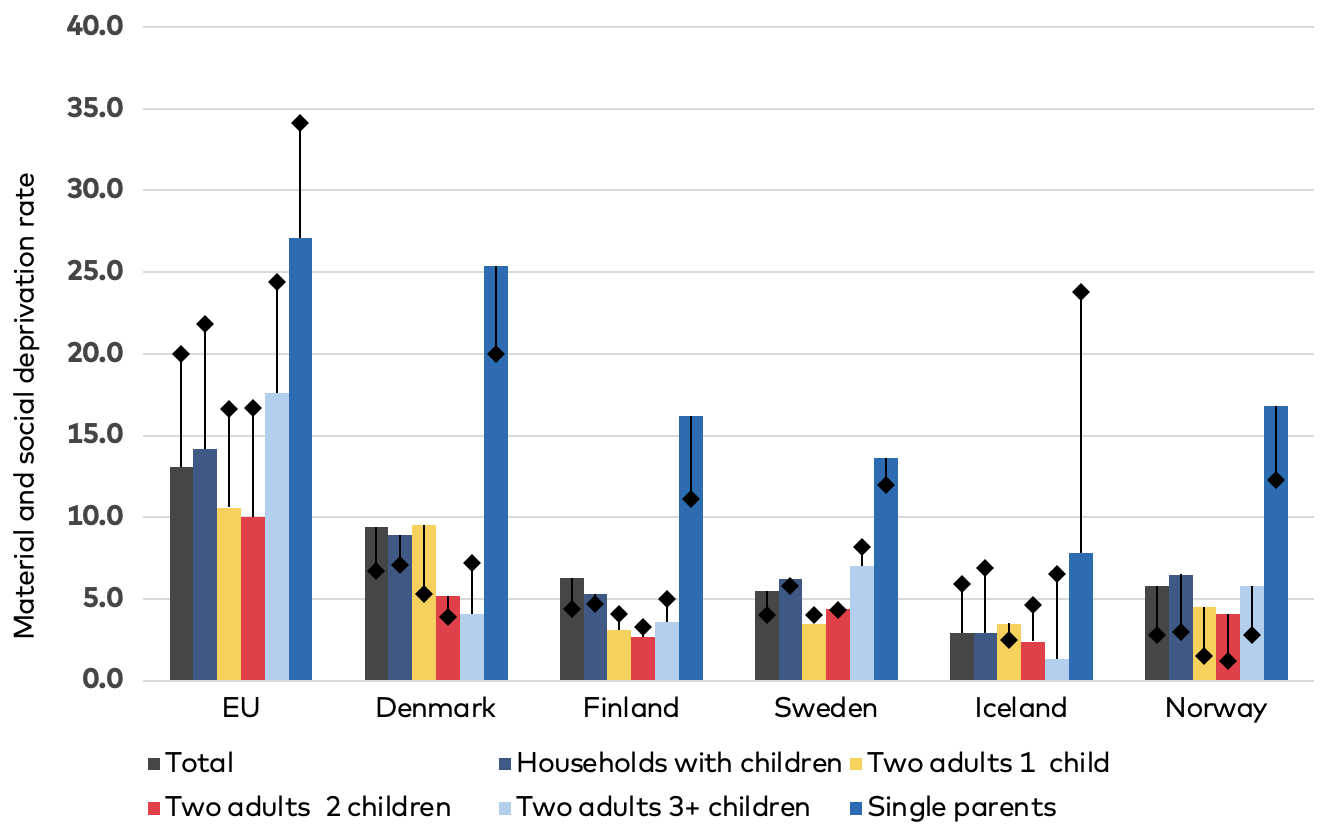
Figure 9: Material and social deprivation rate by household type – 2014 and 2023
Columns: 2023 / Dots: 2014
Source: Eurostat (2025h). Material and social deprivation rate by income quintile and household type (ILC_MDSD02). Note: Values for Iceland are based on 2019, the last available data.
Labour market attachment and educational levels of the household heads
Labour market attachment and extent of work intensity are highly associated with the economic outcome of the household and to the risk of poverty. Household work intensity is calculated by comparing actual months worked by all working-age household members against the total months they could theoretically have worked during the reference period (for more information see Glossary: Persons living in households with low work intensity (Eurostat, 2025g). Figure 10 presents the AROP rate in 2023 for households with dependent children, broken down by work intensity categories used by the Eurostat: very high (0.85–1), high (0.55–0.85), medium (0.45–0.55), low (0.2–.45), and very low (0–0.2). These categories can be interpreted as the extent to which the adults in the households work most of their potentially available time, with very high work intensity representing approximately full-time employment of both spouses in the case of two adults. The poverty risk is defined as the percentage of households earning less than 60% of the median equivalised income. The figure highlights that poverty risk is inversely correlated with work intensity across all countries, with households in the very low work intensity category (0–0.2) consistently exhibiting the highest poverty rates. In the EU, this group shows a poverty risk of approximately 70%, with higher rates among this group in Sweden, reaching almost 90%, and 75% In Norway. Iceland, Finland, and Denmark report lower rates for this category, standing at 55%, 50%, and 45%, respectively. Considering that the AROP rate presented in Figure 10 reflects post-transfer poverty, the difference in the AROP of very low-intensity work households among the Nordic countries once again highlights the role of social transfers in alleviating poverty, especially for households which might have very limited income from work.
As work intensity increases, poverty risks decline sharply. For households in the low (0.2–0.45) and medium (0.45–0.55) work intensity categories, poverty risks remain significant but are considerably lower than those with very low work intensity. The EU maintains poverty risks of around 52% and 32% in these categories, respectively, while Nordic countries except for Sweden report substantially lower rates, often below 25% for medium (0.45–0.55) work intensity category.
As can be expected, households with children with high (0.55–0.85) and very high (0.85–1) work intensity face the very low AROP across all countries, often below 10%. Denmark, Finland, and Norway outperform the EU average showing especially low AROP levels in the very high work intensity category, near 5%.
This illustrates the strong correlation between labour market participation and poverty risk while highlighting the effectiveness of Nordic welfare systems in reducing poverty in Denmark, Finland, and Iceland, particularly among households with lower work intensity. However, the elevated poverty risk among households with very low work intensity underscores the crucial role of employment in poverty prevention, a factor that is particularly significant in Sweden and Norway.
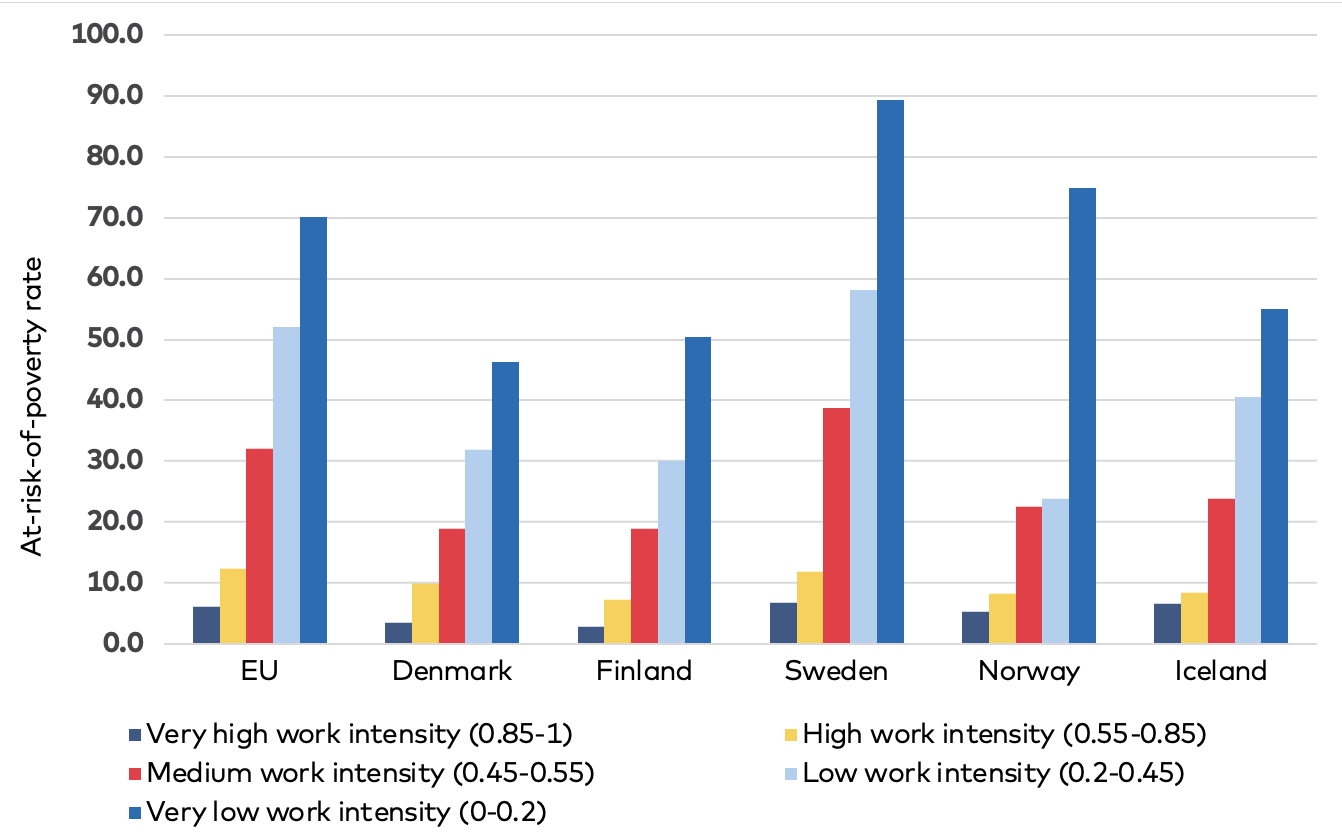
Figure 10: Risk of poverty (% of households) by country and work intensity 2023: Households with dependent children, 60% of median equivalised income
Source: Eurostat (2025b). At-risk-of-poverty rate by poverty threshold, work intensity of the household, and broad age groups (ILC_LI06). Note: Values for Iceland are based on 2019, the last available data.
Figure 11 illustrates the AROP rates for children in 2013 and 2023, with 2013 levels indicated by a black dot, categorised by the educational attainment level of their parents across the Nordics and the EU. The data is disaggregated into three parental education levels: low, medium, and high.
The educational attainment level is classified according to ISCED — the international standard classification of education, using the (latest) 2011 version see https://ec.europa.eu/eurostat/statistics-explained/index.php?title=International_Standard_Classification_of_Education_(ISCED)
We focus on the following aggregations of ISCED levels: ISCED levels 0-2: low, ISCED 3-4: medium, ISCED levels 5-8: high.
We focus on the following aggregations of ISCED levels: ISCED levels 0-2: low, ISCED 3-4: medium, ISCED levels 5-8: high.
While the overall pattern is consistent across countries, some national variations are evident. For instance, Sweden exhibits the greatest disparity based on educational attainment, whereas Iceland has relatively lower poverty rates across all groups. The EU average follows a similar trend but generally reflects higher levels of poverty than those observed in Denmark, Finland, and Iceland.
Over time, as indicated by levels in 2013, the AROP among households with children of low-educated parents has increased slightly in Finland, Iceland, and Norway. In Norway, this increase is about 8% points, highlighting a negative socioeconomic trend for this group and the increasing importance of education of the parents for the risk of poverty of the households.
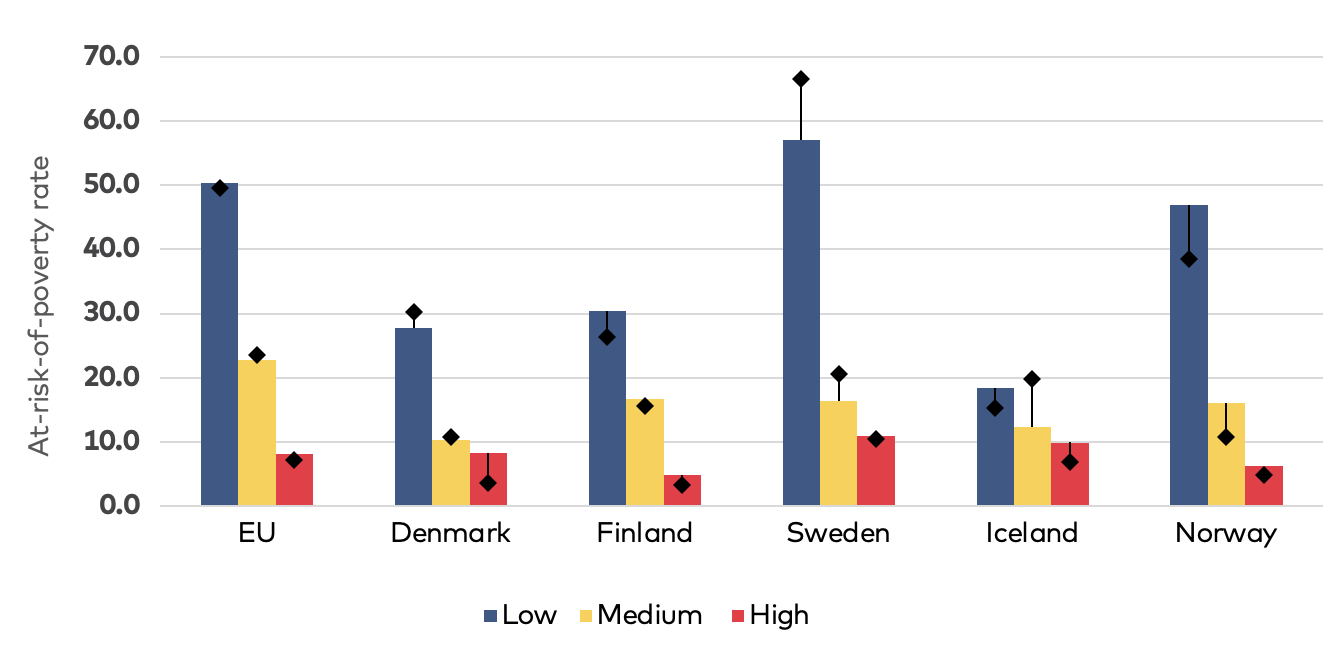
Figure 11: At-risk-of-poverty rate for children by educational attainment level of their parents, 2013, 2023
Columns: 2023 / Dots: 2013
Source: Eurostat (2025e). At-risk-of-poverty rate for children by educational attainment level of their parents (population aged 0 to 17 years) (ILC_LI60). Note: Values for Iceland are based on 2019, the last available data.
Figure 12 presents material and social deprivation rates for children in the EU and Nordic countries based on their parents’ educational attainment in 2014 (black diamond) and 2023. Similar to the findings on the AROP indicator, the results reveal a strong negative correlation between parental education and child deprivation. Across all regions, children whose parents have low educational attainment experience the highest levels of material and social deprivation. This trend is particularly pronounced in the EU, where the deprivation rate for children of parents with low education exceeds 35%, compared to significantly lower rates among children of parents with medium or high educational attainment.
Among the Nordic countries, Denmark and Norway have the highest child deprivation rates for families with low parental education, while Iceland records the lowest overall deprivation levels. In all countries, children of parents with high educational attainment have the lowest deprivation rates, often remaining below 5%. The disparity between educational groups is evident across all countries, underscoring the protective effect of higher parental education against material and social deprivation. Over time, there has been a slight decline in material and social deprivation among children of parents with low educational attainment in Finland, Iceland, and Sweden. However, the overall gradient in the association between parental education and child deprivation has remained relatively stable.
These findings illustrate the relationship between parental education and child poverty. While the Nordic welfare systems are linked to overall lower deprivation rates compared to the EU average, the data indicates that children from low-education households experience disproportionately higher rates.
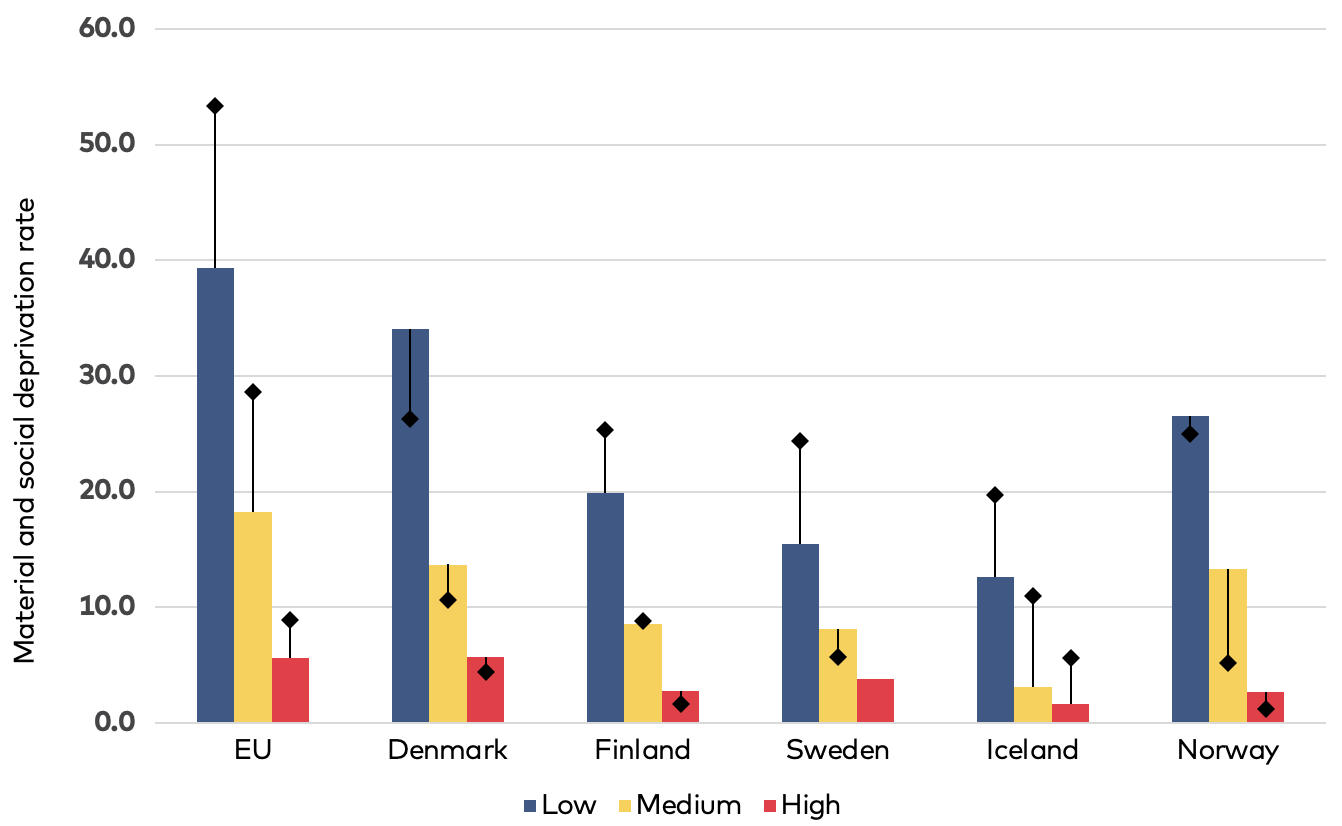
Figure 12: Material and social deprivation rate for children by educational attainment level of their parents, 2014, and 2023
Columns: 2023 / Dots: 2014
Source: Eurostat (2024e).Material and social deprivation rate for children by age and educational attainment level of their parents (ilc_mdsd10). Note: Values for Iceland are based on 2019, the last available data.
Migrant and refugee status
As highlighted in the literature, migrants and particularly refugees are disproportionately represented among low socioeconomic groups and face an elevated risk of poverty, a pattern that extends to their children (Epland & Hattrem, 2023; Galloway et al., 2015; Gustafsson & Österberg, 2016; Obućina & Ilmakunnas, 2020; Salonen et al., 2021). While Eurostat data does not provide specific information on refugee status, it does include details on parental citizenship and place of birth, offering valuable insights into the poverty conditions of migrant families.
Figure 13 illustrates child AROP in 2013 and 2023, based on the parents’ citizenship and place of birth. As expected, children of foreign citizens face a significantly higher risk of poverty compared to children of native citizens. In Denmark and Sweden, for example, children of foreign citizens are three times more likely to be at risk of poverty than citizens of the host country. In Denmark, fewer than 7% of children of native citizens are at risk, compared to over 24% of children of foreign citizens. The disparity is even more pronounced in Sweden, where 46% of children of foreign citizens are at risk of poverty, compared to nearly 13% of children of native citizens.
The gaps are somewhat smaller in Finland, Iceland, and Norway, where children of foreign citizens are 2.6, 1.8, and 1.7 times more likely, respectively, to be at risk of poverty than those of citizens of the host country. Although the data for Iceland is from 2019, it indicates relatively small differences between the poverty risk of children of migrant parents and those of native-citizen parents. In most Nordic countries, the poverty risk for children of foreign citizens has declined somewhat between 2013 and 2023.
The findings regarding the parents’ place of birth closely mirror those based on citizenship, with children of foreign-born parents facing a significantly higher risk of poverty compared to those of native-born parents. The disparities are particularly pronounced in Sweden, Denmark, and Finland. In Sweden, for example, children of migrant parents are more than four times as likely to be at risk of poverty compared to children of native-born parents, with 8% of the latter at risk, compared to over 37% of the former. While the results based on the parents’ place of birth largely mirror those based on citizenship, some differences emerge. Specifically, the risk of poverty among children appears higher when classified by parental citizenship rather than by parental place of birth. This discrepancy may be attributed to the fact that, over time, some migrants acquire citizenship and are thus classified within the native-born group. Moreover, individuals who obtain citizenship are often better integrated, as naturalisation typically requires meeting various conditions, such as a minimum length of residency, language proficiency, and financial self-sufficiency. As a result, those who naturalise are likely to have lower poverty risks compared to those who do not obtain citizenship. In contrast, parental place of birth is a fixed characteristic, making it a more stable indicator for assessing long-term disparities in the poverty risk faced by their children.
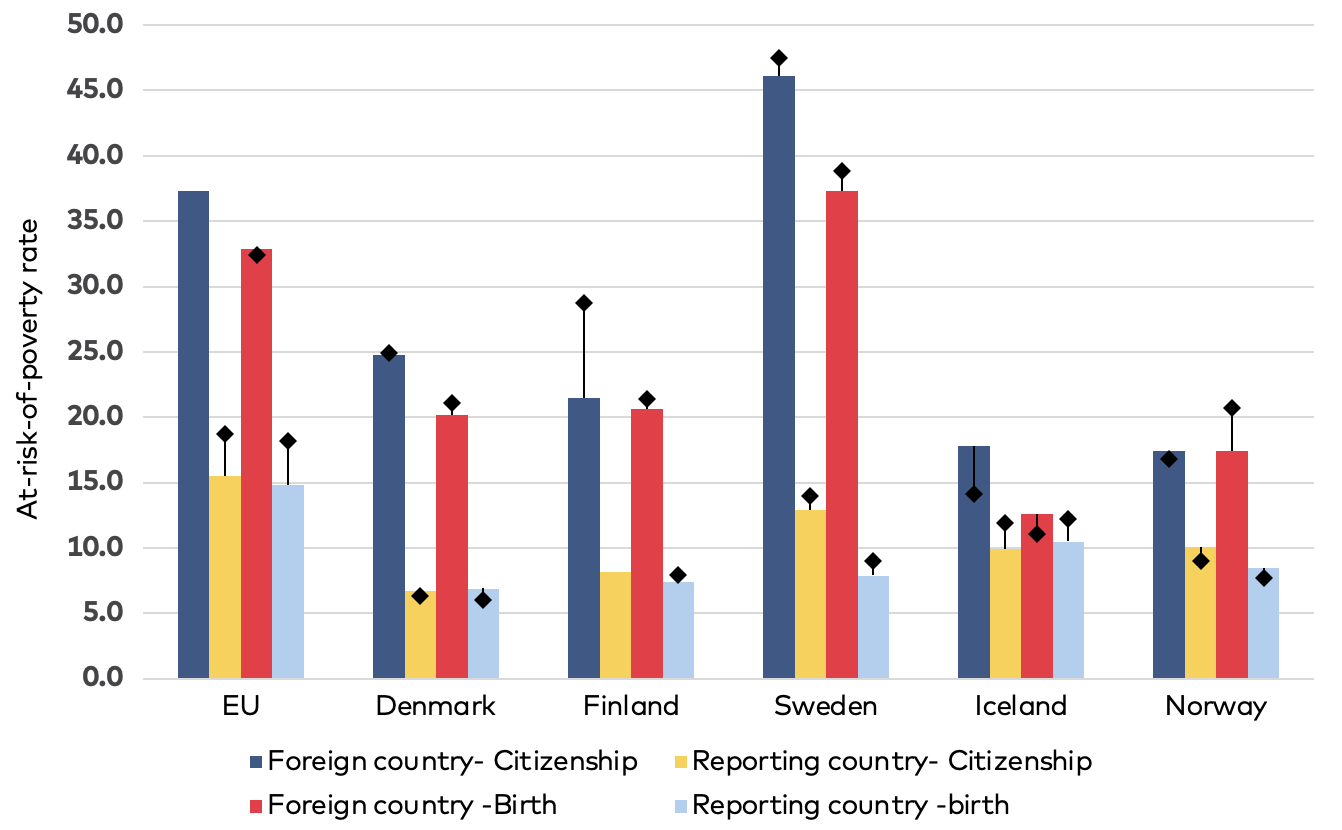
Figure 13: At-risk-of poverty rate for children by country of birth or citizenship of parents (population aged 0 to 17 years), 2013 and 2023
Columns: 2023 / Dots: 2013
Source: Eurostat (2025c). At-risk-of-poverty rate for children by citizenship of their parents (population aged 0 to 17 years) (ILC_LI33), and Eurostat (2025d). At-risk-of-poverty rate for children by country of birth of parents (population aged 0 to 17 years) (ILC_LI34). Note: Values for Iceland are based on 2019, the last available data.
2.6 Future directions
This chapter has examined child poverty in the Nordic countries, exploring patterns and variations across different measures and population groups. While the Nordic countries consistently maintain lower at-risk-of-poverty rates (10–13%) compared to the EU average (16–17%), Sweden stands out as an exception, with a rising poverty trend peaking at 22% in 2021. Though social transfers correspond to reductions in child poverty across the region, Sweden’s post-transfer child poverty rate of almost 20% exceeds both the EU average and the rates in other Nordic countries (10–12%). Norway also experienced a rise in the proportion of children at risk of poverty over the same period, increasing from less than 9% in 2023 to a peak of nearly 15%.
The chapter also reveals significant spatial disparities within the Nordic region, particularly in Sweden and Finland. While Denmark, Iceland, and Norway maintain low overall at-risk-of-poverty rates across municipalities (5–10%), Sweden and Finland show higher levels (15–20%), with nearly 17% of Swedish municipalities and certain rural areas in Finland experiencing child poverty rates above 25%. These regional inequalities highlight the potential value of spatially targeted policy interventions.
Furthermore, child poverty rates vary considerably across demographic groups. Single-parent households and those with three or more children show elevated poverty risks, often exceeding 20%, with single-parent households in Denmark showing pre-transfer poverty rates as high as 56%. Work intensity is strongly associated with poverty outcomes, as households with very low work participation show the highest poverty rates. Additionally, children of parents with low educational attainment and foreign citizenship show higher poverty rates. In Sweden, for example, child poverty rates among foreign citizens reach 46%, compared to 13% among native citizens.
Understanding these patterns requires consideration of the data sources and methods used in the analysis. This chapter primarily relies on aggregated country-level data from Eurostat, derived from EU-SILC surveys, which provide a key source for comparing income and living standards across EU/EEA countries. While these statistics offer useful insights into national trends, they do not capture individual-level variations. Additionally, the reliance on sample-based survey data rather than population-wide registry data means that all estimates are subject to sampling error and statistical uncertainty. Confidence intervals are not routinely reported for all indicators, which means that some of the observed differences – particularly smaller variations between countries, subgroups, or over time – may not be statistically significant. This limitation is particularly relevant when examining specific subgroups of children in low-income households or interpreting fine-grained comparisons. Furthermore, since Eurostat poverty indicators are primarily based on relative poverty, they provide limited insight into absolute poverty and long-term changes in living conditions.
Moreover, this analysis takes a broad perspective, and assessing Nordic countries solely through the lens of relative poverty may not fully capture the complexities of child poverty. Differences in non-monetary support, such as school-based nutritional programmes, and housing assistance, could influence child well-being in ways not entirely reflected in poverty data. Nonetheless, despite these considerations, the overall trends in the at-risk-of-poverty (AROP) rate remain discernible, providing a useful basis for drawing broader conclusions.
The Nordic countries have access to register data that can provide a more detailed picture of child poverty. Unlike sample surveys, these datasets allow for more granular analyses, making it possible to examine variations in child poverty with greater precision. They also support multivariate analyses that can help identify factors associated with low income among families with children, such as parental employment status, household composition, education level, and regional differences. However, these data are not publicly available and require applications and appropriate analytical tools to access through national statistical institutes. Furthermore, combining them into a unified Nordic dataset presents methodological and administrative challenges, making this a potentially valuable avenue for future research. Also, these datasets support analysis of how various social welfare programmes relate to child poverty outcomes. By comparing policy approaches across different Nordic countries, researchers and policymakers can examine which measures are associated with lower levels of economic vulnerability among children. Another important area of study is the higher representation of children with immigrant backgrounds in low-income groups. These insights can inform the design of policies that address the needs of vulnerable children.
Overall, while the Nordic welfare model is associated with relatively low child poverty rates in comparative terms, Sweden’s higher poverty rates, regional variations, and differences across demographic groups point to areas where policy approaches may warrant further attention. Targeted social support, labour market participation, and attention to educational and integration outcomes could contribute to more equitable opportunities for well-being and economic security among children across the Nordic countries.